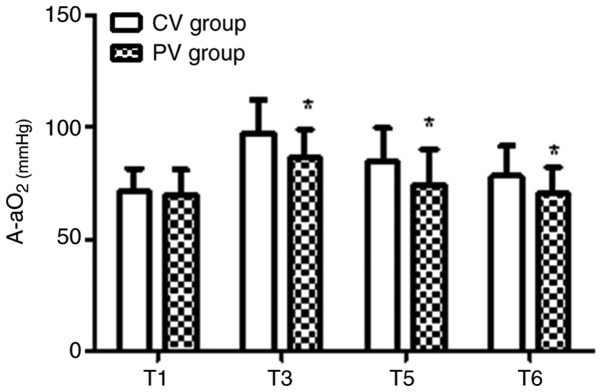
Figure 4.
Intra-operative and post-operative pulmonary A-aO2. In the PV group, the A-aO2 was lower compared with that in the CV group at T3, T5 and T6. Values are expressed as the mean ± standard deviation. *P<0.05 vs. CV group. Time-points: T1, after endotracheal intubation; T3, 60 min after pneumoperitoneum; T5, 30 min after tracheal extubation; T6, on the day after the surgery. A-aO2, alveolar-arterial differences for oxygen; CV, conventional ventilation; PV, protective ventilation.

