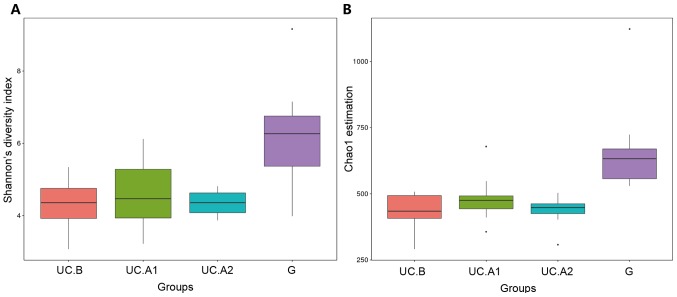
Figure 3.
α diversity analysis. (A) The diversity of the fecal microbiota (Shannon's diversity index). (B) The richness of the fecal microbiota (Chao1 estimator). The lower and upper margins of the box represent the 25th and 75th percentiles, with the extended arms representing the 10th and 90th percentiles, respectively. The median is presented as a horizontal line within the box. UC, ulcerative colitis; UC.B, patients before FMT; UC.A1, patients 4 weeks after FMT; UC.A2, patients 12 weeks after FMT; G, healthy donors.

