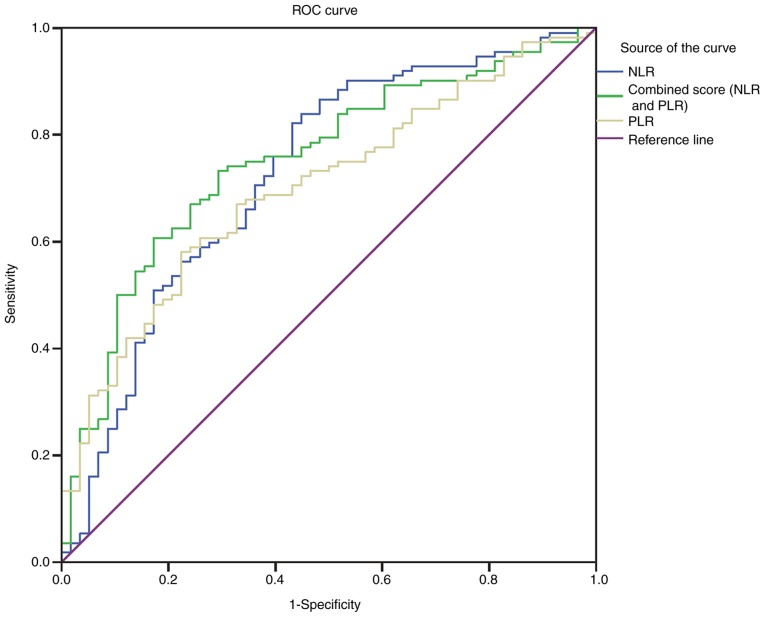
Figure 4.
ROC analysis of NLRPLR in the 6-month PSD. ROC curve demonstrating the sensitivity as a function of specificity for predicting the post-stroke depression within 6 months, based on the levels of the NLR and PLR. NLR, neutrophil-to-lymphocyte ratio; PLR, platelet-to-lymphocyte ratio; ROC, receiving operator curve.

