
Fig. 6. Kv3.4 inactivation, pH and NaHS.
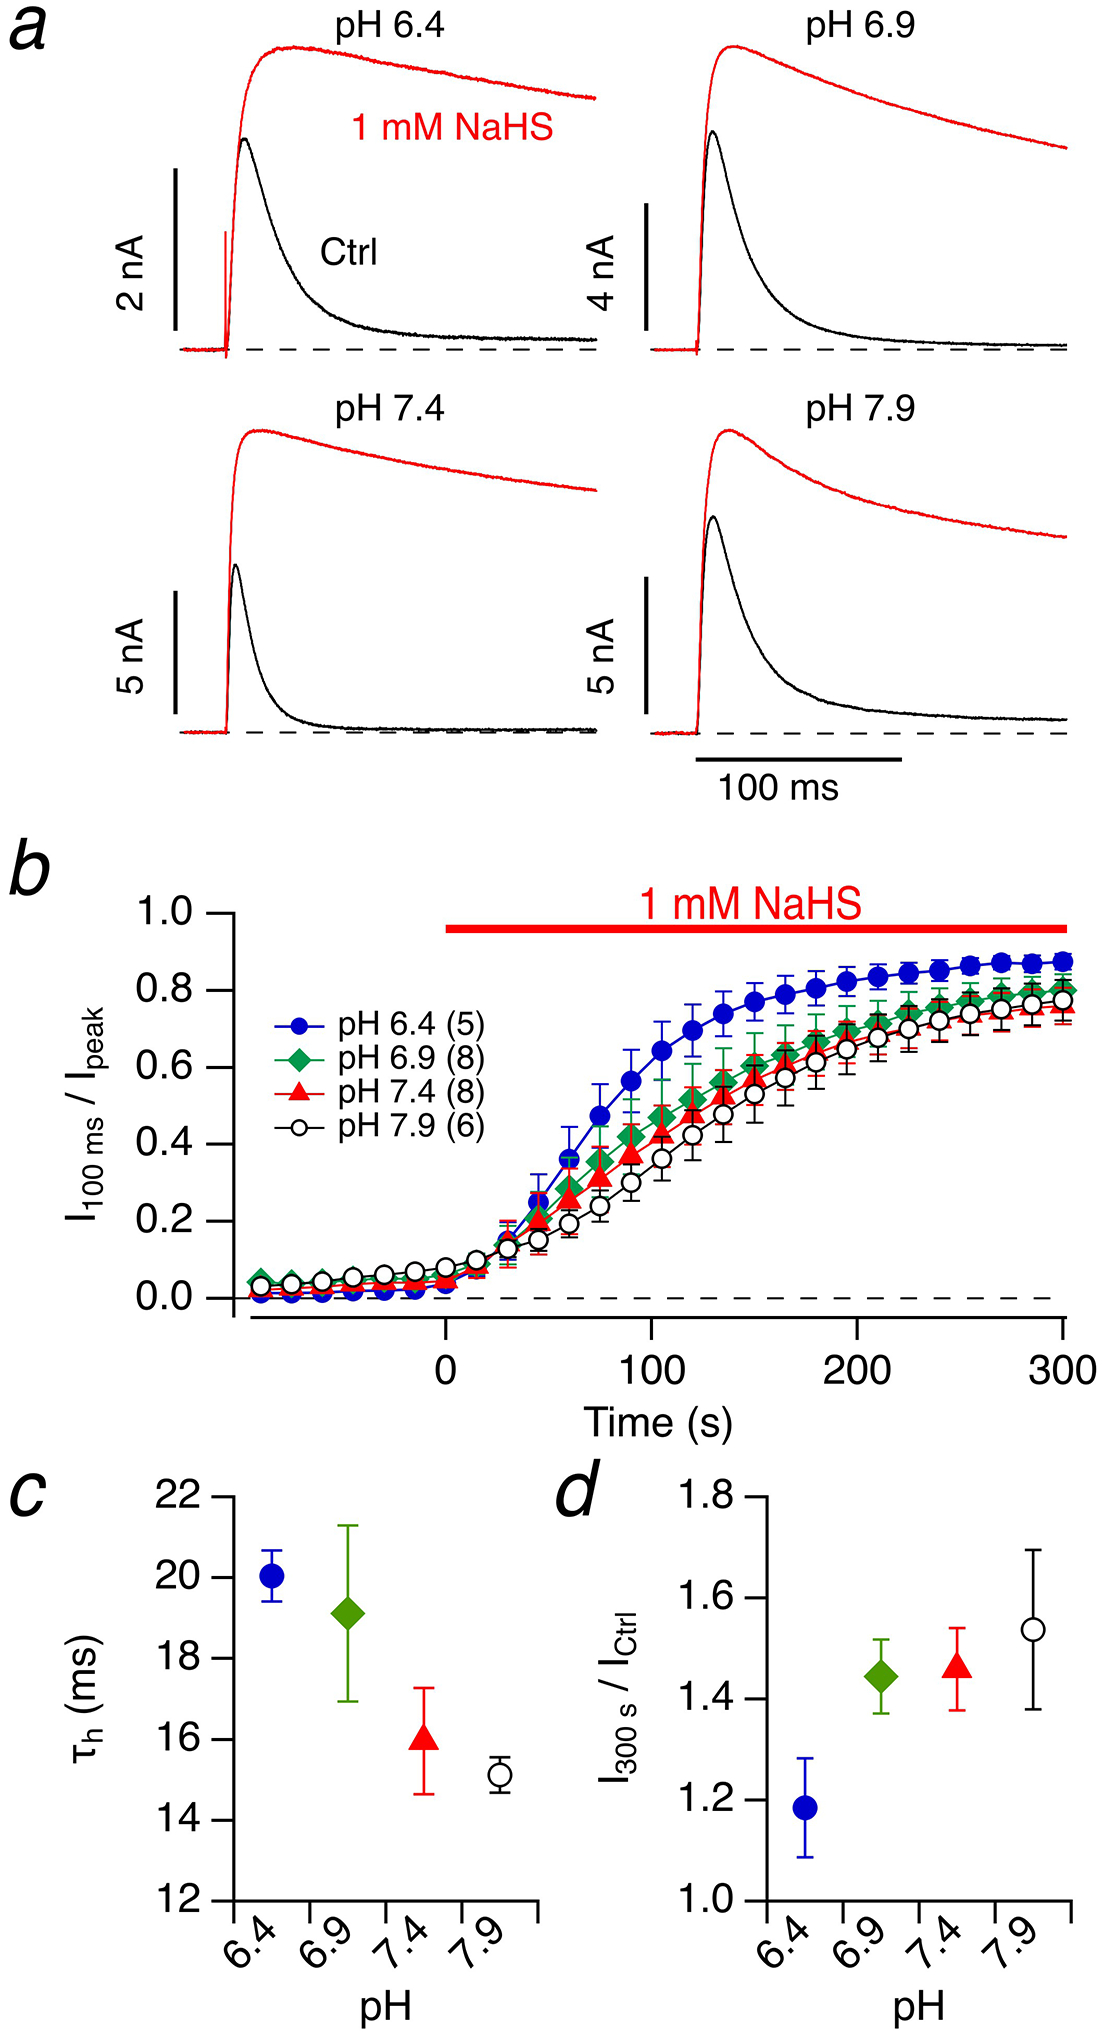
a Representative whole-cell current traces of Kv3.4 channels in HEK293T cells in response to membrane depolarization to 50 mV from a holding potential of −100 mV before (black) and 300 s after application of bath solution with 1 mM NaHS (red) at the indicated intracellular and extracellular pH values. b Time course of the inactivation index for the indicated pH values. c Time constant of inactivation under control conditions as a function of pH. d Alteration of peak current after 1 mM NaHS application for 300 s as a function of pH. Data in b-d) are means±SEM with n in parentheses in panel b)