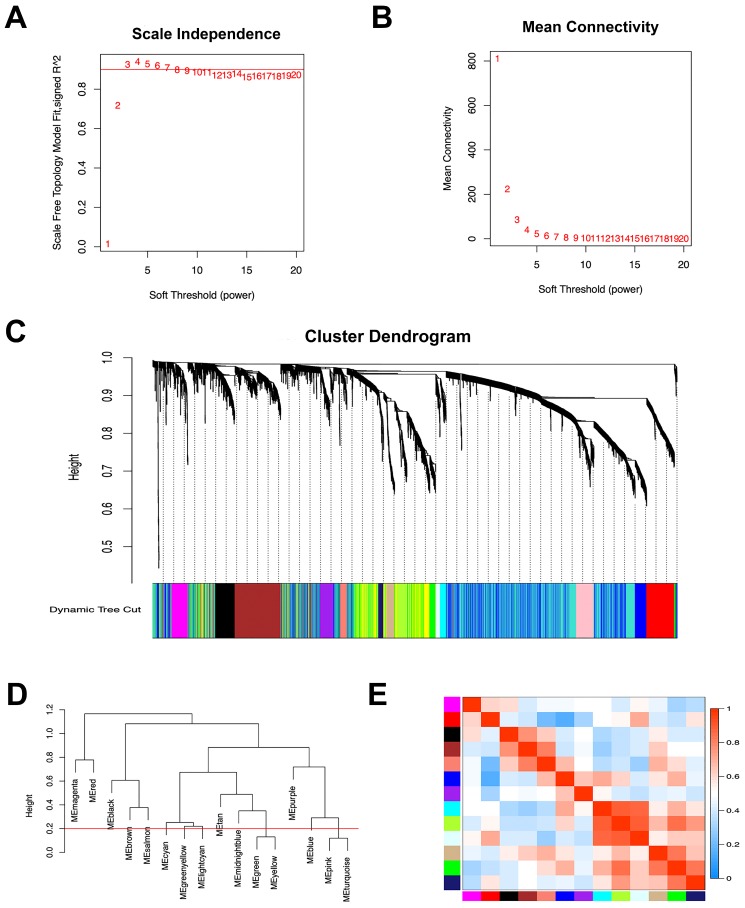
Figure 1.
Construction of co‑expression module of gastric cancer with peritoneal metastasis. (A) The correlation of different soft threshold power values and scale independence of co-expression network. (B) The effect of soft threshold power values on mean connectivity of co-expression network. (C) The hierarchical cluster dendrogram was used to identify co-expression gene modules and each module was assigned with different colors. (D) Gene modules with similar expression profiles were merged according to the threshold (Red line) by calculating eigengenes of each module. (E) Heatmap plot of the adjacencies of modules. Red means positive correlation and blue means negative correlation.

