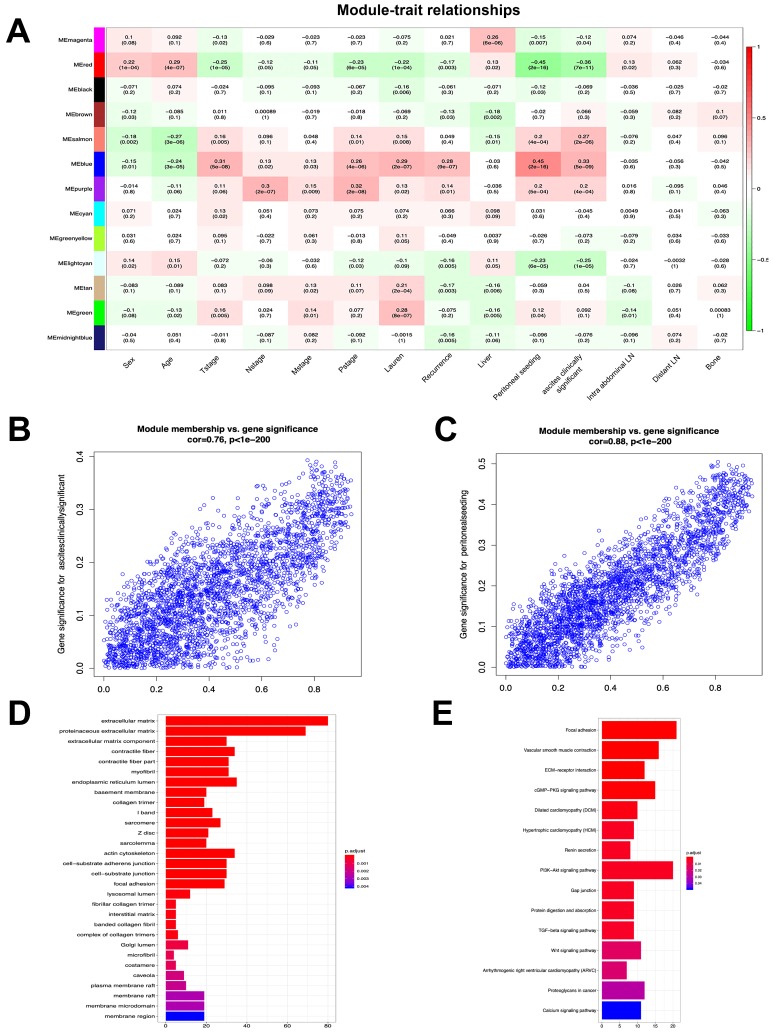
Figure 2.
Module-trait correlations and functional enrichment analysis. (A) Each row corresponds to module eigengene, column to a clinical trait. Numbers in each table describe the correlation and p value of module eigengenes and trait. The table is color-coded by correlation according to the color legend. (B) The correlation of genes in blue module with trait of ascites clinically significant. (C) The correlation of genes in blue module with trait of peritoneal seeding. (D) Significantly enriched GO annotations of blue module. (E) Significantly enriched KEGG pathways of blue module.

