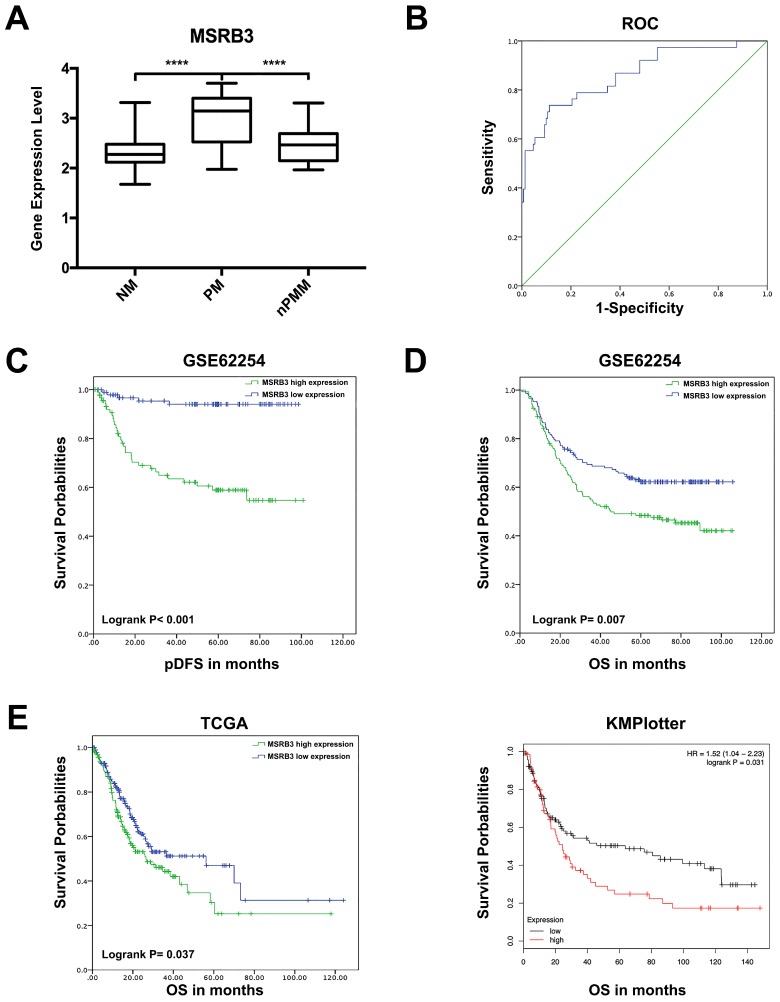
Figure 4.
Prognostic value of MSRB3 in gastric cancer. (A) The expression level of MSRB3 in peritoneal metastasis group (PM), non-metastasis group and non-peritoneal metastasis group. Data are mean±SD. ****P<0.0001 (Student's t-test). (B) Receiver operating characteristic curve for MSRB3 expression level and peritoneal metastasis. (C) peritoneal Disease-Free Survival (pDFS) of MSRB3 in TCGA cohort by Kaplan-Meier (KM) analysis (log-rank P < 0.001). (D) Overall Survival (OS) of MSRB3 in TCGA cohort by Kaplan-Meier (KM) analysis (log-rank P = 0.007). (E) External validation of overal survival of TCGA and KMplotter cohort by Kaplan-Meier (KM) analysis (log-rank P = 0.037, P = 0.031, respectively).

