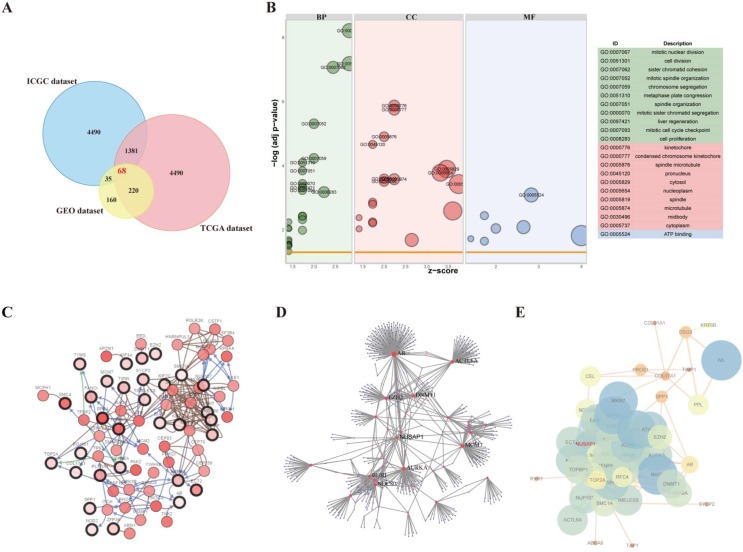
Figure 1.
Identification of differentially expressed genes (DEGs) in cervical squamous cell carcinoma and endocervical adenocarcinoma (CESC). A. Venn diagram demonstrates the intersections of DEGs between GEO, TCGA, and ICGC data. B. Bubble plot of significantly enriched gene ontology (GO) terms for the DEGs. C. Co-expression analysis was performed using cBioportal. D. The protein-protein interaction (PPI) network of DEGs was generated using NetworkAnalyst. E. The PPI network of 68 DEGs is shown.

