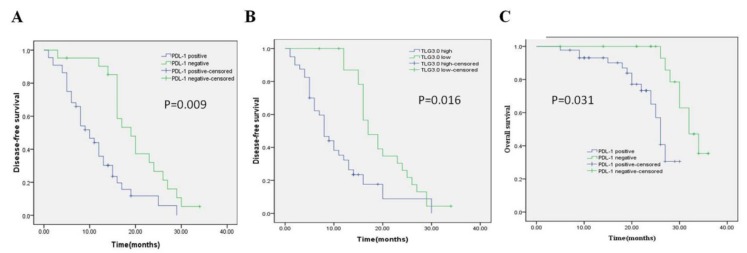
Figure 4.
Kaplan-Meier survival curves for patients with CRC. (A) DFS curves for patients with negative PD-L1 expression and patients with positive PD-L1 expression. (B) DFS curves for patients with a low TLG3.0 and patients with a high TLG3.0. (C) OS curves for patients with negative PD-L1 expression and patients with positive PD-L1 expression.

