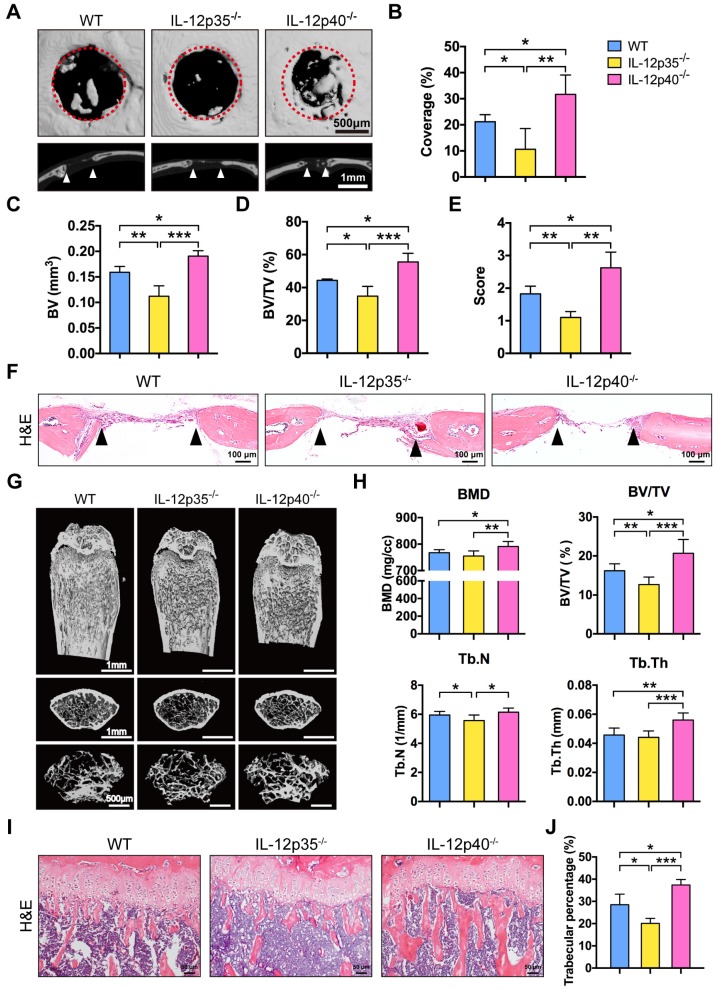
Figure 2.
IL-23 deficiency improves calvarial defect repair and enhances bone mass. (A) Microcomputed tomography (micro-CT) three-dimensional reconstruction of bone repair in mouse calvarial defects. Red dotted lines indicate the periphery of the defect site. n = 4-5 per group. Scale bar, 500 µm (upper panel), 1 mm (lower panel). (B) Defect area coverage (%) was calculated via micro-CT images from WT, IL-12p35-/-, and IL-12p40-/- mice. (C-E) Micro-CT analysis including (C) bone volume (BV), (D) bone volume/tissue volume (BV/TV), and (E) healing score for the extent of bony bridging and bone union. (F) The H&E staining of calvarial bone defects. n = 4-5 per group. Scale bar, 100 µm. (G) Representative images showed trabecular architecture by micro-CT three-dimensional reconstruction in distal femurs of 2-month-old mice. n = 4-5 per group. Scale bar, 1mm (upper and middle panel), 500 µm (lower panel). (H) Micro-CT measurements for the indicated parameters in distal femurs. Bone mineral density (BMD), BV/TV, trabecular numbers (Tb.N), and trabecular thickness (Tb.Th) were determined by micro-CT analysis. n = 4-5 per group. (I) The H&E staining of femur sections from 2-month-old WT, IL-12p35-/-, and IL-12p40-/- mice were shown. n = 4-5 per group. Scale bar, 50 µm. (J) Trabecular percentage (%) was quantified via H&E images from the groups described in I. WT, wild-type. Results are shown as mean ± S.D. *p<0.05, **p<0.01, ***p<0.001.

