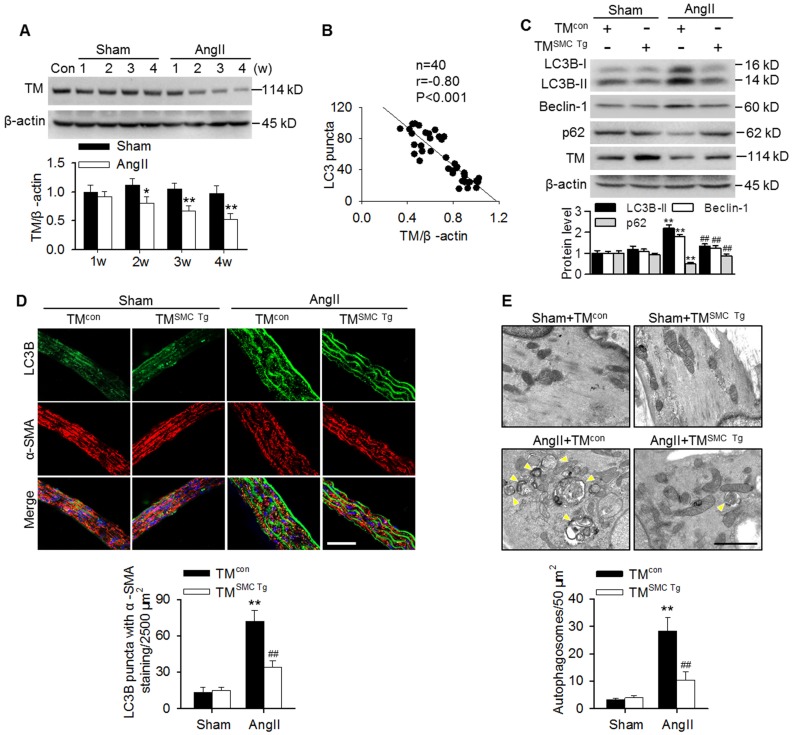
Figure 2.
TMEM16A inhibited AngII-induced autophagy in aortas. (A) TMEM16A (TM) expression in aortas from AngII-induced hypertensive mice was lower than that in the corresponding sham mice from 2 weeks after operation. *P < 0.05, **P < 0.01 vs. corresponding sham group, Student's t-test. n = 10 mice/group. (B) Correlation between LC3B puncta and TMEM16A expression. (C) The expression levels of LC3B-II, Beclin-1 and p62 in aortas from TMSMC Tg and TMcon mice after saline (sham) or AngII administration for 4 weeks. **P < 0.01 vs. sham + TMcon; ##P < 0.01 vs. AngII + TMcon, one-way ANOVA. n = 8 mice/group. (D) Representative immunofluorescence staining of LC3 (green) and α-SMA (red) in aortas. Scale bars, 20 µm. Quantification of LC3B puncta. Five random fields (2,500 µm2/filed) were measured in one section. **P < 0.01 vs. sham + TMcon; ##P < 0.01 vs. AngII + TMcon, one-way ANOVA. n = 14 sections from seven mice per group. (E) Transmission electron microscopy images showing autophagosomes (yellow arrowhead) in the medial layer of mouse aortas. Scale bars, 1 µm. Total autophagosome formation per 50 µm2 area in each section was quantitated. **P < 0.01 vs. sham + TMcon; ##P < 0.01 vs. AngII + TMcon, one-way ANOVA. n = 18 sections from six mice per group.

