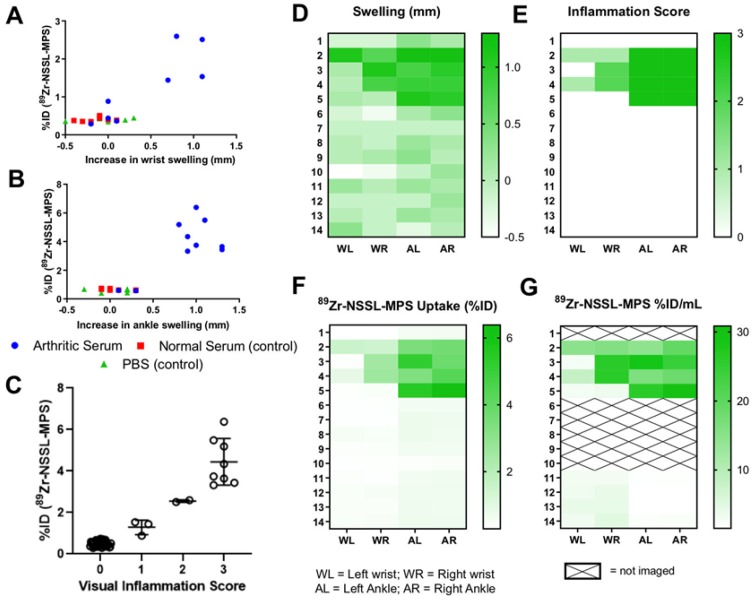
Figure 5.
(A) Plot of %ID of 89Zr-NSSL-MPS versus swelling of wrists, (B) versus swelling of ankles, and (C) versus visual inflammation scores (all joints from all groups) at day 9 post serum injection; (D-G) Heatmaps showing (D) joint swelling, (E) visual inflammation scores, (F) 89Zr-NSSL-MPS uptake (%ID) from ex-vivo biodistribution and (G) image-quantified uptake (%ID/mL) (G) for all mice at day 9.

