Figure 7.
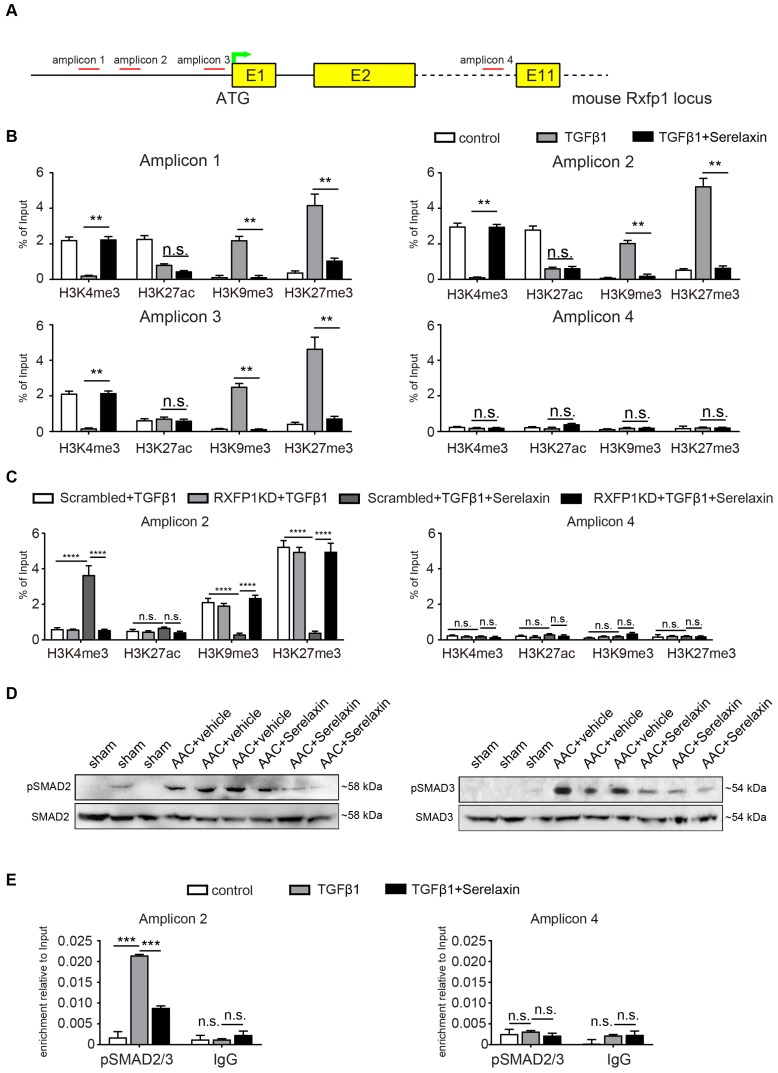
Serelaxin reactivates Rxfp1 expression via histone modifications. (A) Schematic representing the mouse Rxfp1 locus with locations of CHIP-qPCR primers. (B) qPCR analysis showing the enrichment of 4 different histone modification marks (active: H3K4me3 and H3K27ac, repressive: H3K9me3, H3K27me3) in the Rxfp1 promoter region (Amplicon 1-3) and intron 10 (Amplicon 4). The enrichment of TGFβ1-influenced H3K4me3, H3K9me3 and H3K27me3 marks were significantly compromised by Serelaxin if performed with amplicons 1-3 targeting the promoter region but not with amplicon 4 targeting intron10. (C) ChIP-qPCR analysis showing the enrichment of histone modification marks in the Rxfp1 promoter region after RXFP1 knockdown. Upon RXFP1 knockdown, treatment with Serelaxin did not significantly increase the activating modifications or decrease the repressive modification marks. (D) Western blot analysis showing protein levels of pSMAD2 and pSMAD3 in sham, AAC-operated and AAC-operated+Serelaxin-treated mouse hearts, total SMAD2 and SMAD3 were used as protein loading controls. AAC-operated hearts showed increased levels of pSMAD2 and pSMAD3 compared to sham. Upon treatment with Serelaxin these protein levels were significantly reduced. (E) qPCR analysis showing the enrichment of pSMAD2/3 in the Rxfp1 promoter region (Amplicon 2) and intron 10 (Amplicon 4). The enrichment of TGFβ1-induced pSMAD2/3 was significantly compromised by Serelaxin. The qPCR analysis with primer targeting intron10 did not show any significant differences between these groups. Student t-test was used for single comparison and one-way ANOVA with Bonferroni post-hoc analysis was used for multiple group comparisons. Gene expression and associated error bars, representing mean ± SEM, n≥3, n.s. no significance, ** p<0.01, *** p<0.001, **** p<0.0001.

