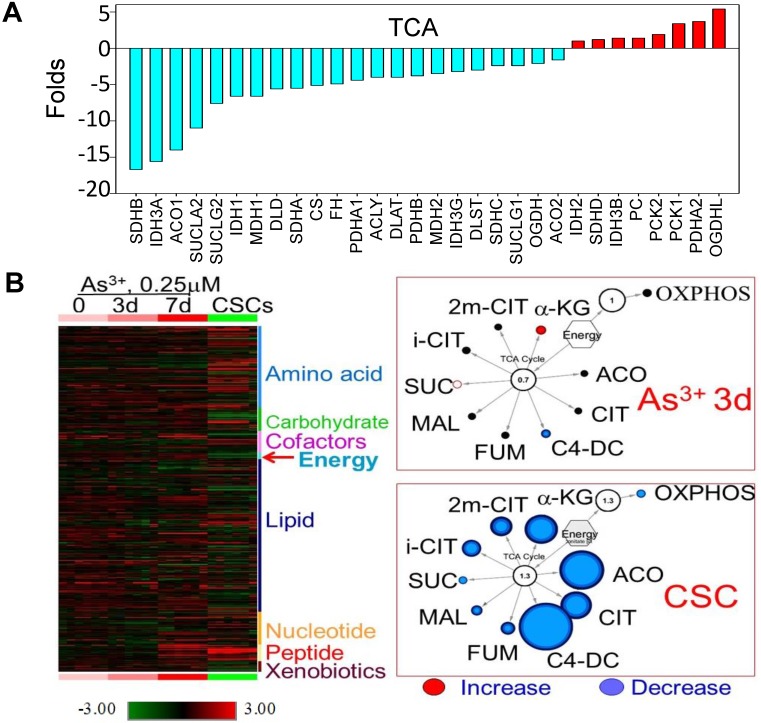
Figure 2.
Diminished mitochondrial TCA cycle in the iAs-induced CSCs. A. The expression levels of the genes in TCA cycle. B. Metabolomics analysis of the BEAS-2B cells treated with 0.25 μM iAs for 3 days, 7 days, and 6 months (CSCs). Left panel shows heatmap of metabolites. Right two panels show decreased TCA cycle metabolites in the cells treated with iAs for 3 day and the iAs-induced CSCs.

