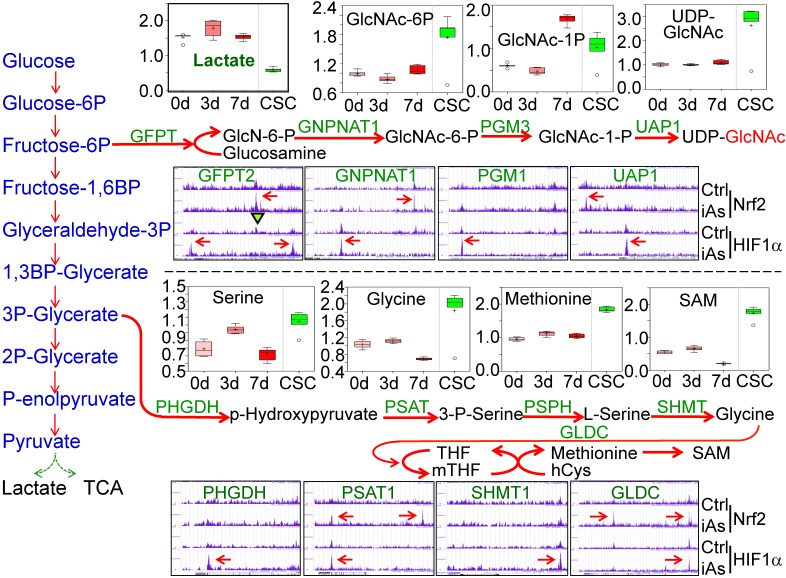
Figure 7.
iAs-induced Nrf2 and HIF1α regulates the HBP and serine/glycine pathways of glycolysis. Upper half: Panels above the HBP pathway diagram show the actual levels of lactate and the major metabolites in HBP pathway as determined by quantitative metabolomics. Panels under the HBP show ChIP-seq data of the indicated HBP pathway genes. Lower half: Panels above the serine/glycine pathway diagram show the levels of the metabolites in this pathway as determined by quantitative metabolomics. Panels under the serine/glycine pathway diagram show ChIP-seq data of the key genes in this pathway. The iAs-induced enrichment of Nrf2 and/or HIF1α were indicated by red arrows.

