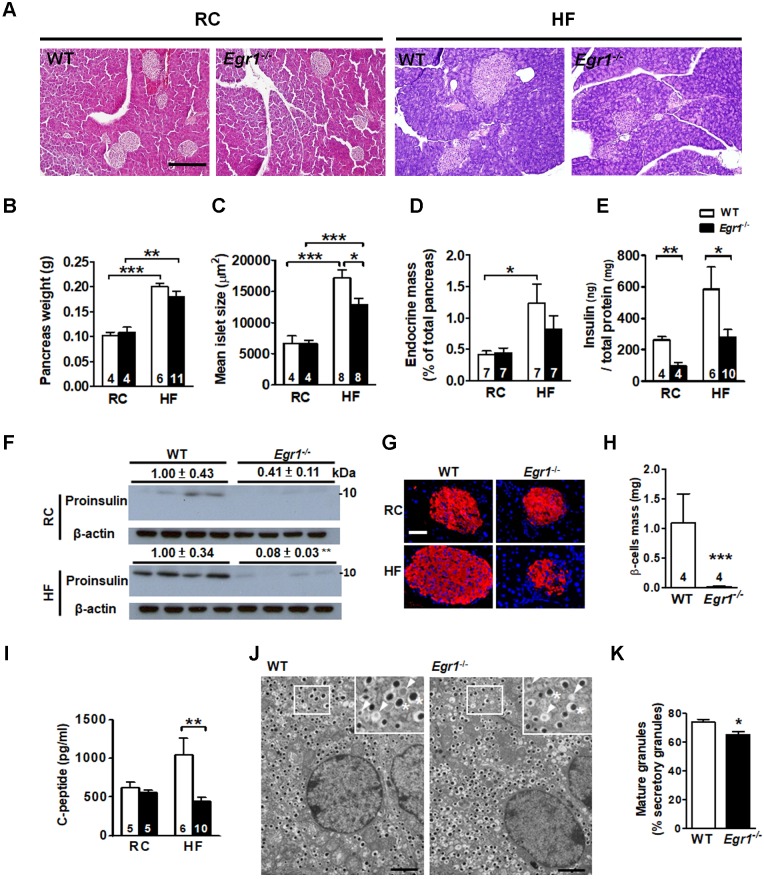
Figure 2.
Failure to increase islet size and insulin content in response to HF feeding in Egr1-/- mice. A: Morphology of pancreas from 5-month-old male mice fed RC and a HF for 3 months. Scale bar: 200 μm. B: Pancreas weight (g), C: mean islet size (μm2), D: endocrine mass (%) were measured in sections from pancreas of RC- and HF-fed mice. E and F: Insulin protein levels in the pancreas lysate determined by (E) ELISA or (F) immunoblot. The relative intensities of the bands by densitometric quantification to WT are indicated. G: Immunofluorescence images (Insulin, red; Nuclei, blue) in the pancreatic tissue from 5-month-old male mice fed RC and a HF diet for 3 months. (Scale bars, 50 μm). H: β-cell mass (mg) in sections from pancreas of 5-month-old male mice fed a HF diet for 3 months. I: Fasting plasma C-peptide levels from 4-month-old male mice fed RC and a HF diet for 2 months. Numbers of mice are inside bars. J: Representative transmission electron microscopic images of pancreatic β-cell of HF-fed WT and Egr1-/- mice. Scale bar, 2 μm. Photomicrograph at upper right illustrates mature granules (asterisk) and immature granules (arrowhead) at a higher magnification. K: Percentage of mature granules. Averages of granule percentages inside bars were from 8 fields for each genotype (40 μm2 for each field). *P<0.05, **P<0.01, and ***P<0.001.

