Figure 4.
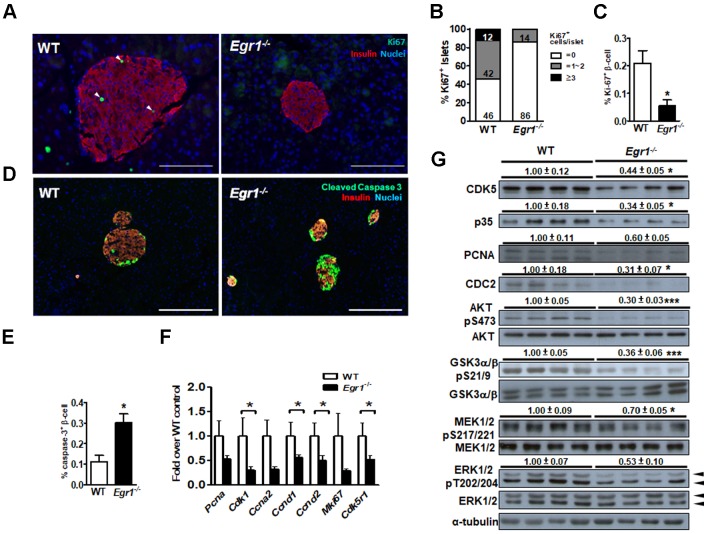
EGR-1 deficiency exhibits reduced proliferation and neogenesis in the islet upon HF feeding. A: Immunofluorescence staining for Ki67 (green) and B: quantification of Ki67+ cells in the pancreas of 5-month-old male WT (n=4) and Egr1-/- (n=4) mice fed a HF diet for 3 months. Numbers inside bars are accumulated percentages of different categories of Ki67+ cell number per islet. C: Quantification of Ki67-positive insulin-positive cells. Scale bar: 50 μm. D: Immunofluorescence staining for cleaved caspase-3 (green) in the pancreatic islets. Images are co-stained for insulin (red) and nuclei (blue). Scale bar: 200 μm. E: Quantification of caspases-3-positive insulin-positive cells. F: mRNA levels of proliferation markers in the isolated islets of HF-fed Egr1-/- (n=10) mice relative to WT (n=6) mice. G: Immunoblot analysis on proliferation-related markers and signaling molecules. The relative intensities of the bands by densitometric quantification to WT are indicated. *P<0.05 and ***P<0.001.

