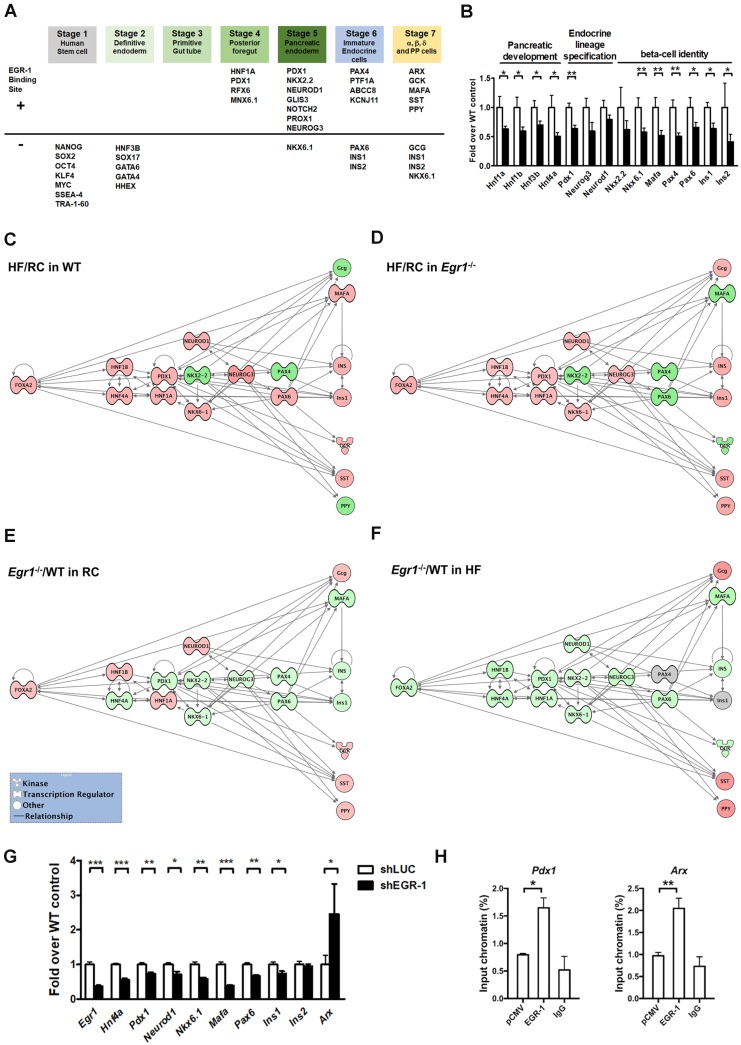
Figure 7.
Decreased transcriptional network in the islets of HF-fed Egr1-/- mice. A: Bioinformatics analysis in identification of transcriptional factors and endocrine molecules that contain potential EGR-1 binding site. Sequences for proteins involved in the development program of islet lineages were analyzed for potential EGR-1 binding site using the PROMO transcription factor binding site database. B: Expression of genes for pancreatic development, endocrine lineage specification and β-cell identity in the isolated islets of HF-fed Egr1-/- (n=10) relative to WT (n=6) mice. *P<0.05 and **P<0.01 compared to WT mice. Pathway analysis of the response of HF feeding on the islets of (C) WT and (D) Egr1-/- mice using Ingenuity Pathways Analysis (IPA) software. Pathway analysis of the effect of EGR-1 deficiency on the transcription network in (E) RC and (F) HF diet feeding. Color shading corresponds to the type of dysregulation: red for up-regulated and green for down-regulated genes according to the results of quantitative PCR. The shape of the node indicates the major function of the protein: transcription regulators (dumbbell); kinases (three arrows); and others (circle). G: Expression of genes in EGR-1 knockdowned (n=5) relative to control (n=5) MIN6 cells. H: ChIP assay in EGR-1 overexpressed and control (pCMV) MIN6 cells. Sequences containing the potential EGR-1 binding sites in Pdx1 and Arx were amplified by real-time PCR. n=3 in each group. *P<0.05, **P<0.01, and ***P<0.001.

