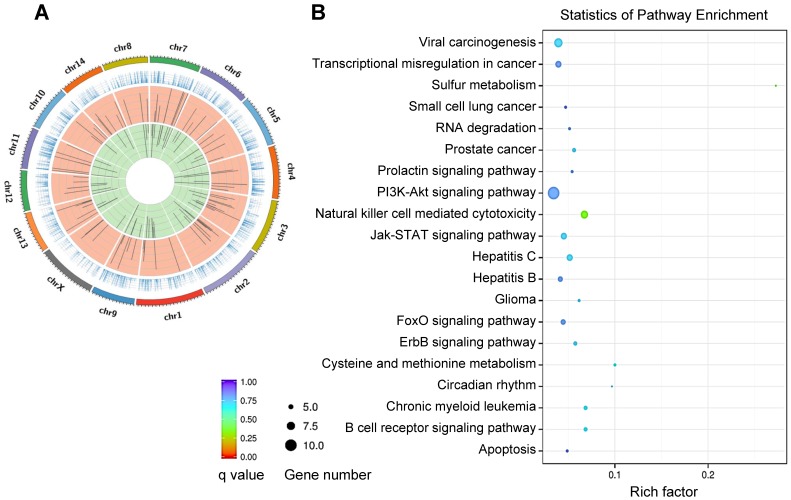
Figure 2.
REV‑ERBα controlled genes and pathways. (A) Circos plot of differentially expressed genes between Rev-erbα-/-and wild-type mice, showing a disturbance in genome-wide gene expression. In the Circos plot, the outermost circle depicts the ideograms of each chromosome; the second circle represents gene expression levels; the third circle shows the distribution of the up-regulated genes; and the fourth circle shows the distribution of the down-regulated genes. (B) KEGG pathway analysis of Rev-erbα-induced differentially expressed genes in mouse liver (top 20 pathways are shown).

