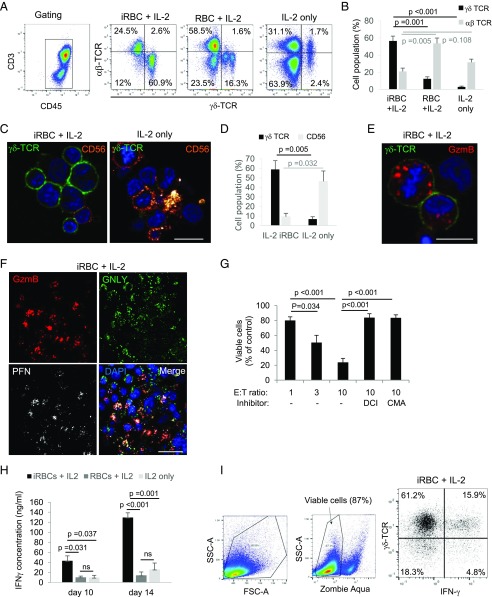
FIGURE 1.
γδ T cells expand and develop cytolytic potential in response to P. falciparum–infected RBC supernatants. PBMCs were treated with culture supernatant of parasitized RBCs (iRBCs) and IL-2, with supernatant of non-iRBCs + IL-2, or with IL-2 alone for 14 d. Following the activation, the cells were stained with anti-CD3/anti-CD45 Abs (A for the gating), TCR Abs (A, C, and E), Abs against CD56 (C), and Abs against cytotoxic effector molecules (E and F) for analysis by flow cytometry and confocal microscopy. For microscopy, the nuclei were stained with DAPI. Scale bars, 10 μm (C and E) and 20 μm (F). (B) The quantification of three independent flow cytometry experiments (using PBMCs of two different donors) concerning the frequency of γδ versus αβ TCR expression. The microscopy results of (C) were quantified by counting 50 cells per condition in three independent experiments as shown in (D). (G) iRBC-activated cells were analyzed for their cytolytic potential in fluorescence release assays against the target cell line K562 at indicated E:T ratios. DCI was used to inhibit Gzm activity, and CMA served as a PFN inhibitor. (H) IFN-γ levels in the supernatants of cultures with indicated activation conditions were measured by ELISA. (I) A representative cytometry plot of three independent experiments demonstrating intracellular IFN-γ in γδ T cells. (B, D, G, and H) Bars represent average ±SEM in three independent experiments. The p values of statistical differences between groups, calculated by Student t test, are indicated.

