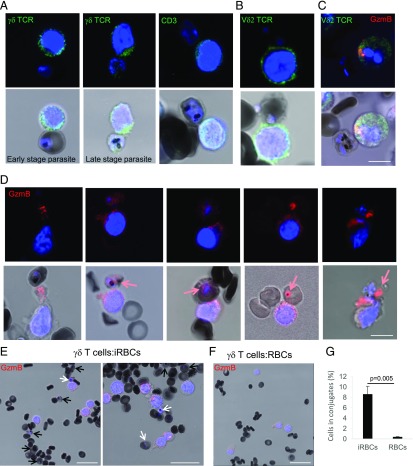
FIGURE 2.
γδ T cells bind P. falciparum–infected RBCs to release GzmB. Effector cells activated with iRBC supernatant and IL-2 were incubated with P. falciparum–infected RBCs for 60 min and stained with indicated T cell surface markers (green in A–C), GzmB Ab (red in C–F), and Hoechst as nuclear marker (blue). Formation of stable conjugates between killer cells and iRBCs was visualized by confocal microscopy. Scale bars, 10 μm (A–D) and 20 μm (E and F). Representative images of at least four independent experiments are presented. (D) Transfer of GzmB into iRBCs is indicated with red arrows in the merge images. (E) iRBCs in conjugation with killer cells are indicated with white arrows, and unconjugated iRBCs are indicated with black arrows. (G) Quantification of the frequency of RBC–killer cell conjugations. One hundred iRBCs and >200 RBCs were counted in three independent experiments.

