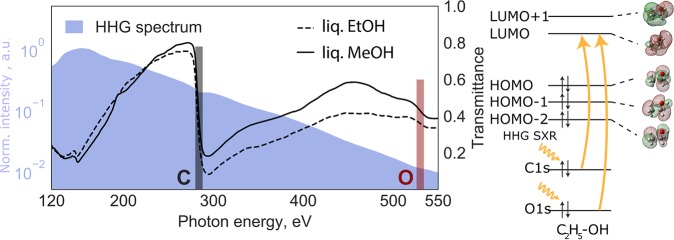
Figure 1.
Left: Static SXR absorption spectra. The shaded area is the high-harmonic spectrum displayed on a logarithmic intensity scale. The dashed and solid lines represent the transmittance spectra of liquid ethanol and methanol, respectively, through a sub-micrometer-thin flat liquid jet. These overview spectra have been recorded with the MCP detector. Right: Schematic representation of the molecular orbitals of the ethanol molecule using the 6-31G** basis set and the observed X-ray transitions.

