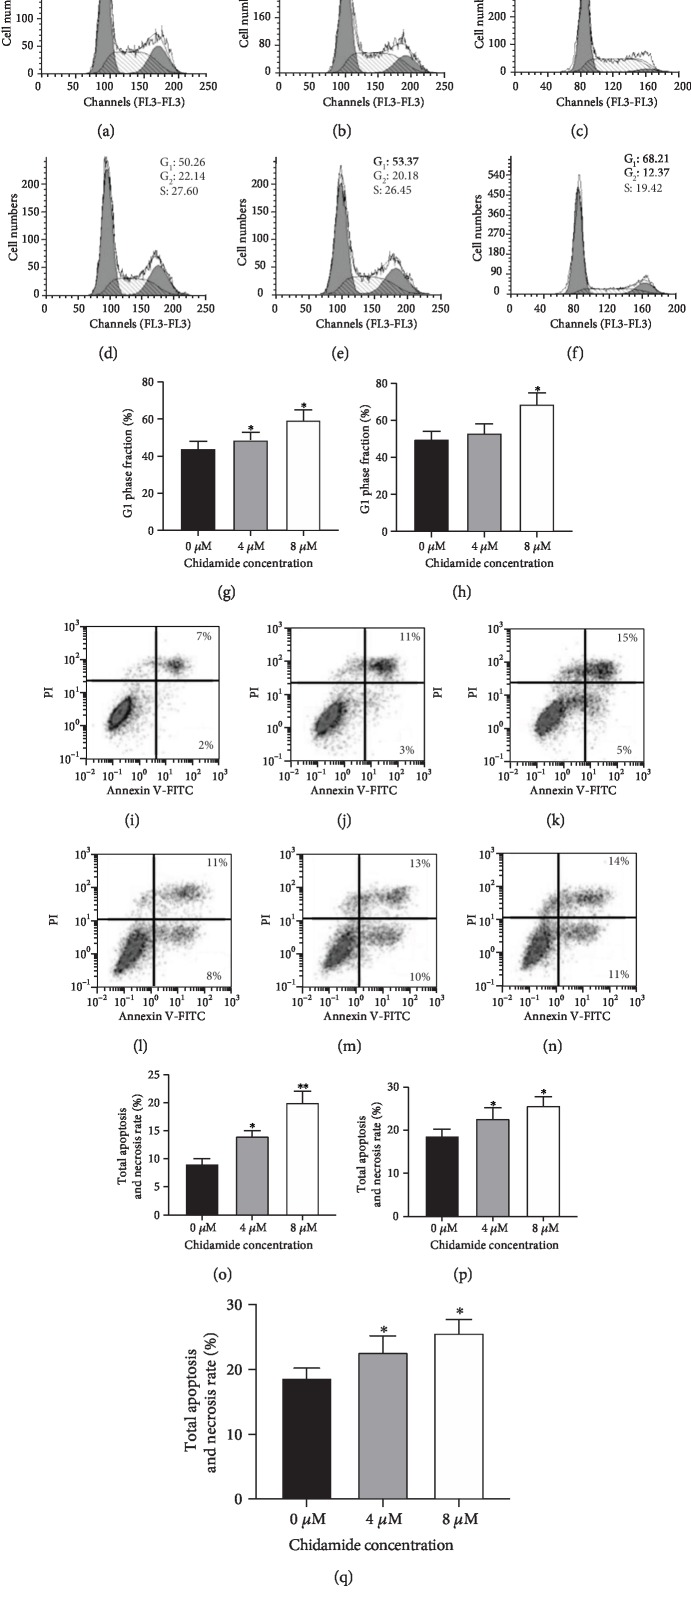
Figure 3.
Flow cytometry analysis of the cell cycle, necrosis, and apoptosis. (a) The proportions of the U87 cells blocked at the G0/G1 phase after being treated with 0 μM chidamide. (b) The proportions of the U87 cells blocked at the G0/G1 phase after being treated with 4 μM chidamide. (c) The proportions of the U87 cells blocked at the G0/G1 phase after being treated with 8 μM chidamide. (d) The proportions of the HS683 cells blocked at the G0/G1 phase after being treated with 0 μM chidamide. (e) The proportions of the HS683 cells blocked at the G0/G1 phase after being treated with 4 μM chidamide. (f) The proportions of the HS683 cells blocked at the G0/G1 phase after being treated with 8 μM chidamide. (g) Phase fraction in HS683 cells after being treated with different concentrations of chidamide. (h) G1 phase fraction in U87 cells after being treated with different concentrations of chidamide. (i) G1 phase fraction in HS683 cells after being treated with different concentrations of chidamide. (j) The proportions of the U87 cells with apoptosis and necrosis after being treated with 0 μM chidamide. (k) The proportions of the U87 cells with apoptosis and necrosis after being treated with 4 μM chidamide. (l) The proportions of the U87 cells with apoptosis and necrosis after being treated with 8 μM chidamide. (m) The proportions of the HS683 cells with apoptosis and necrosis after being treated with 0 μM chidamide. (n) The proportions of the HS683 cells with apoptosis and necrosis after being treated with 4 μM chidamide. (o) The proportions of the HS683 cells with apoptosis and necrosis after being treated with 8 μM chidamide. (p) The total apoptosis and necrosis rates in U87 cells after being treated with different concentrations of chidamide. (q) The total apoptosis and necrosis rates in HS683 cells after being treated with different concentrations of chidamide. All data are expressed as mean ± SD (N = 6) and ∗P < 0.05 and ∗∗P < 0.01 vs. the 0 μM chidamide group.

