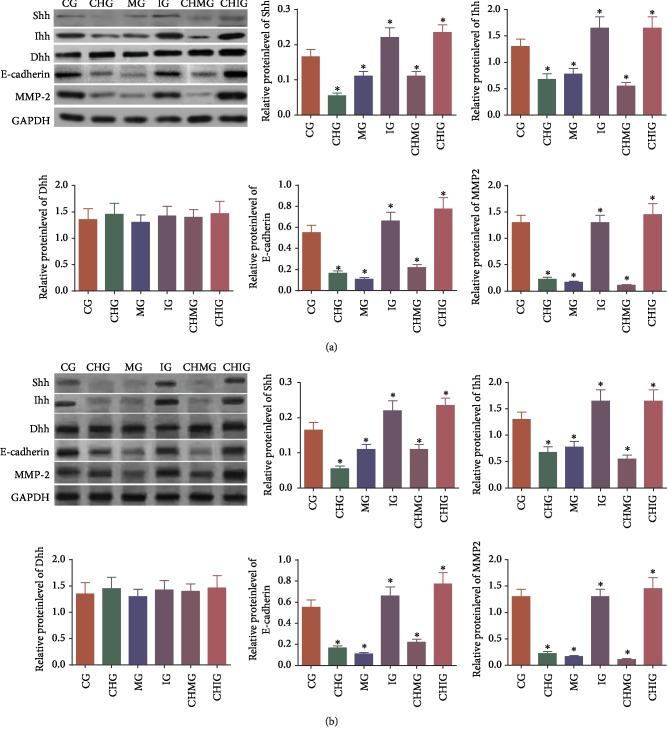
Figure 8.
Western Blot analysis of the effects of chidamide (10 μM) on the relative protein level of the Hedgehog signaling and migration protein. (a) U87 glioma cells. (b) HS683 glioma cells. CG: control group; CHG: chidamide group; MG: miR-338-5p mimic group; IG: miR-338-5p inhibitor group; CHMG: chidamide-treated miR-338-5p mimic group; CHIG: chidamide-treated miR-338-5p inhibitor group; Shh: Sonic Hedgehog; Ihh: Indian Hedgehog; Dhh: Desert Hedgehog; MMP-2: matrix metalloproteinase-2. N = 5 for each group and ∗P < 0.05, ∗∗P < 0.01, and ∗∗∗P < 0.001 vs. the CG group.

