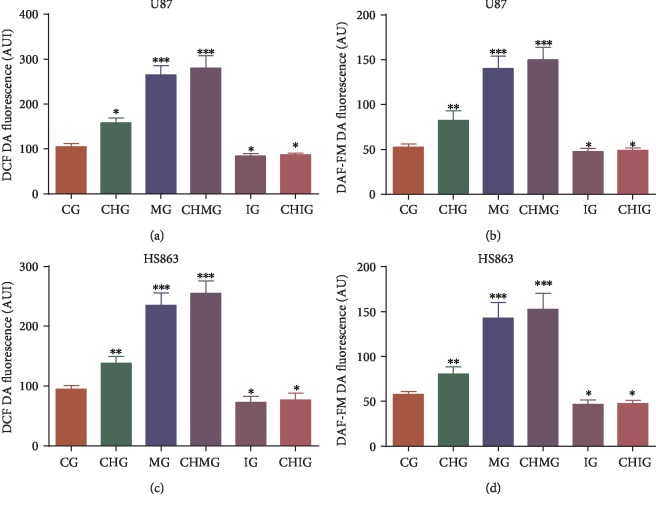
Figure 9.
The oxidative levels among different groups. Glioma cells were labeled with (a) DCF DA and/or DAF-FM DA, and intracellular fluorescence was measured using a plate reader to estimate ROS and RNS. (a) ROS levels in U87 glioma cells. (b) RNS levels in U87 glioma cells. (c) ROS levels in HS683 glioma cells. (d) RNS levels in HS683 cells. CG: control group; CHG: chidamide group; MG: miR-338-5p mimic group; IG: miR-338-5p inhibitor group; CHMG: chidamide-treated miR-338-5p mimic group; CHIG: chidamide-treated miR-338-5p inhibitor group. N = 5 for each group and ∗P < 0.05, ∗∗P < 0.01, and ∗∗∗P < 0.001 vs. the CG group.

