Figure 2.

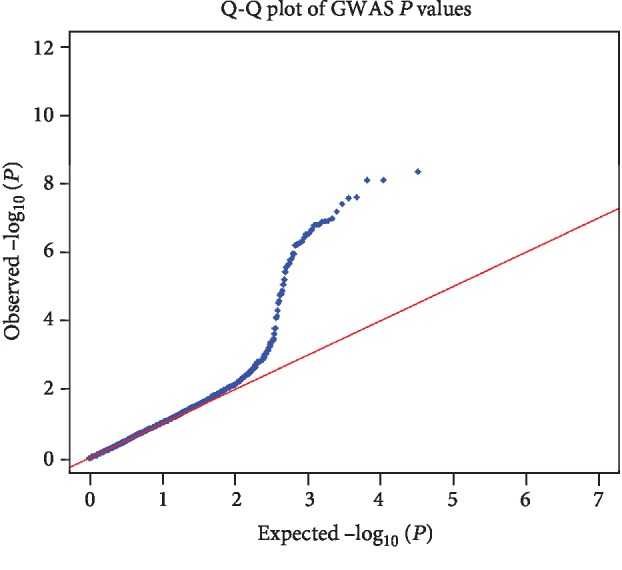
Quantile-quantile (Q-Q) plot of SNPs from ITP GWAS in Chinese Han population. X-axis is the expected value (-log10 (P)), and Y-axis is the actual observed value (-log10 (P)).

Quantile-quantile (Q-Q) plot of SNPs from ITP GWAS in Chinese Han population. X-axis is the expected value (-log10 (P)), and Y-axis is the actual observed value (-log10 (P)).