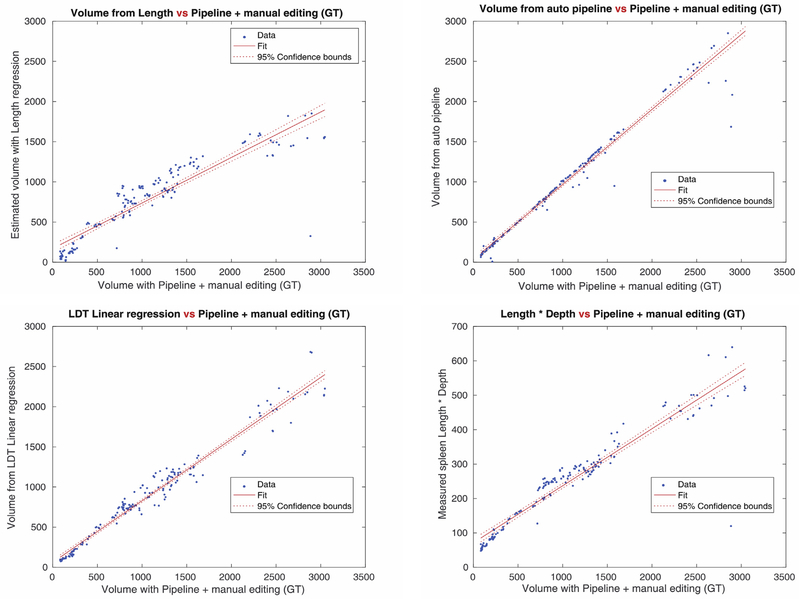
Fig. 3a.
Correlation score map for each regression and estimation method, and the pipeline method. Correlation scores from each method are 0.9151(Top left, Linear regression with Length), 0.9447(Top right, Length x Depth estimate), 0.9817(Bottom left, Linear regression with Length, Depth, and Thickness), 0.9848(Bottom right, the pipeline method with deep learning). The pipeline method shows the highest correlation score among the volume measurement methods.

