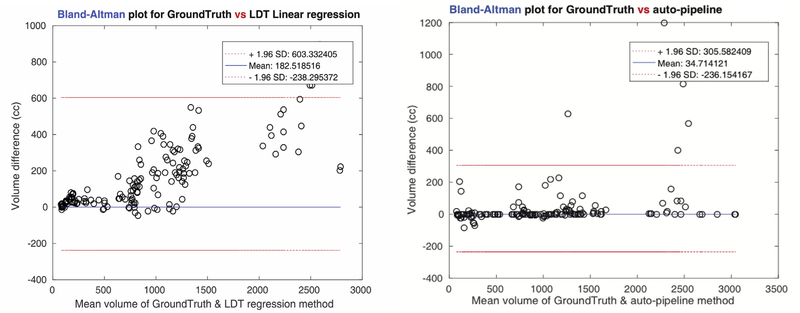
Fig. 3b.
Bland-Altman plots for two cases (Length, Depth, Thickness regression, and the pipeline). Since among three linear regression methods, volume estimate with the Length, Depth, Thickness showed the best correlation, its performance is compared to the pipeline method. The volume difference is remarkably smaller at the pipeline method (variance of estimated volume difference = 471) than at the L, D, T regression (variance of estimated volume difference = 826).

