
Fig. 6.
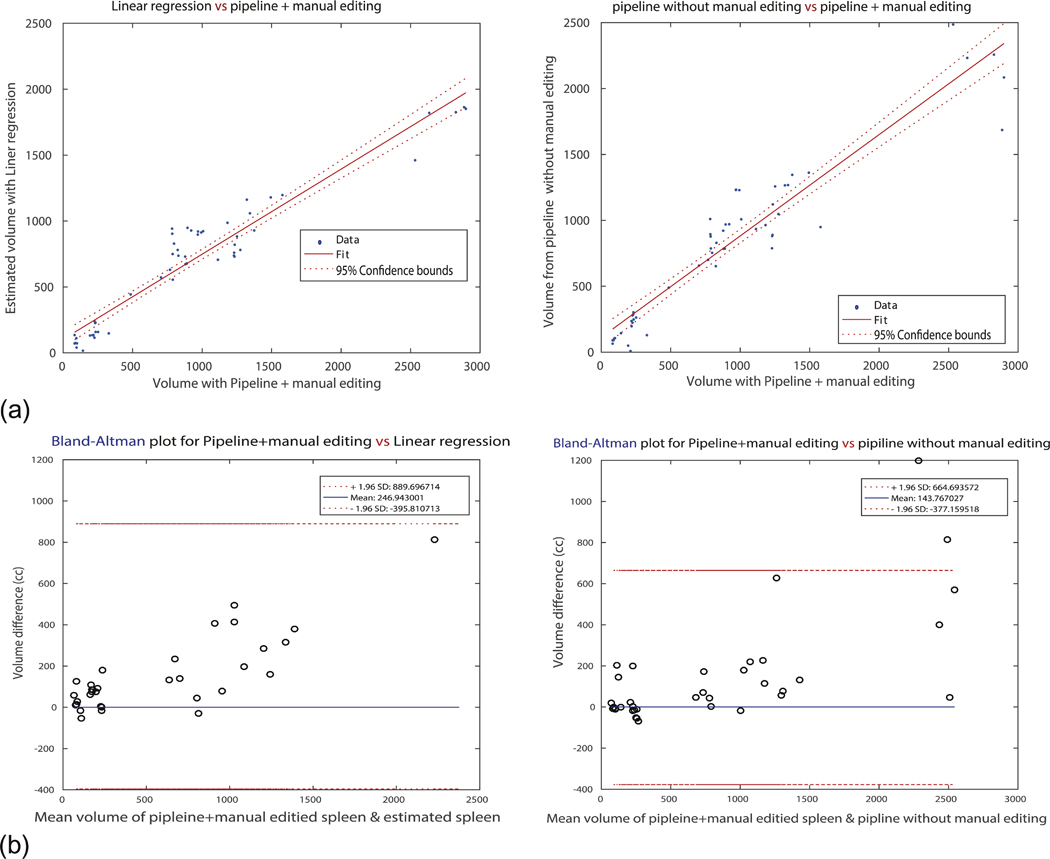
Robustness of the pipeline. It shows correlation score and Bland-Altman volume differences only for the scans that are ‘manually edited’ after running the pipeline process. (a) Represents correlation map for left: spleen volume from linear regression estimation and spleen volume from the pipeline with manual editing (GT), and right: spleen volume from the pipeline and GT. X-axis for both plots is the group evaluated as all ‘good’ by radiologist. It is remarkable that for the large spleens, the pipeline method shows degraded performance. (b) Introduces Bland-Altman plots for both two cases. It can be verified that the difference gap of linear regression estimated volumes is bigger (wider) than the pipeline method.