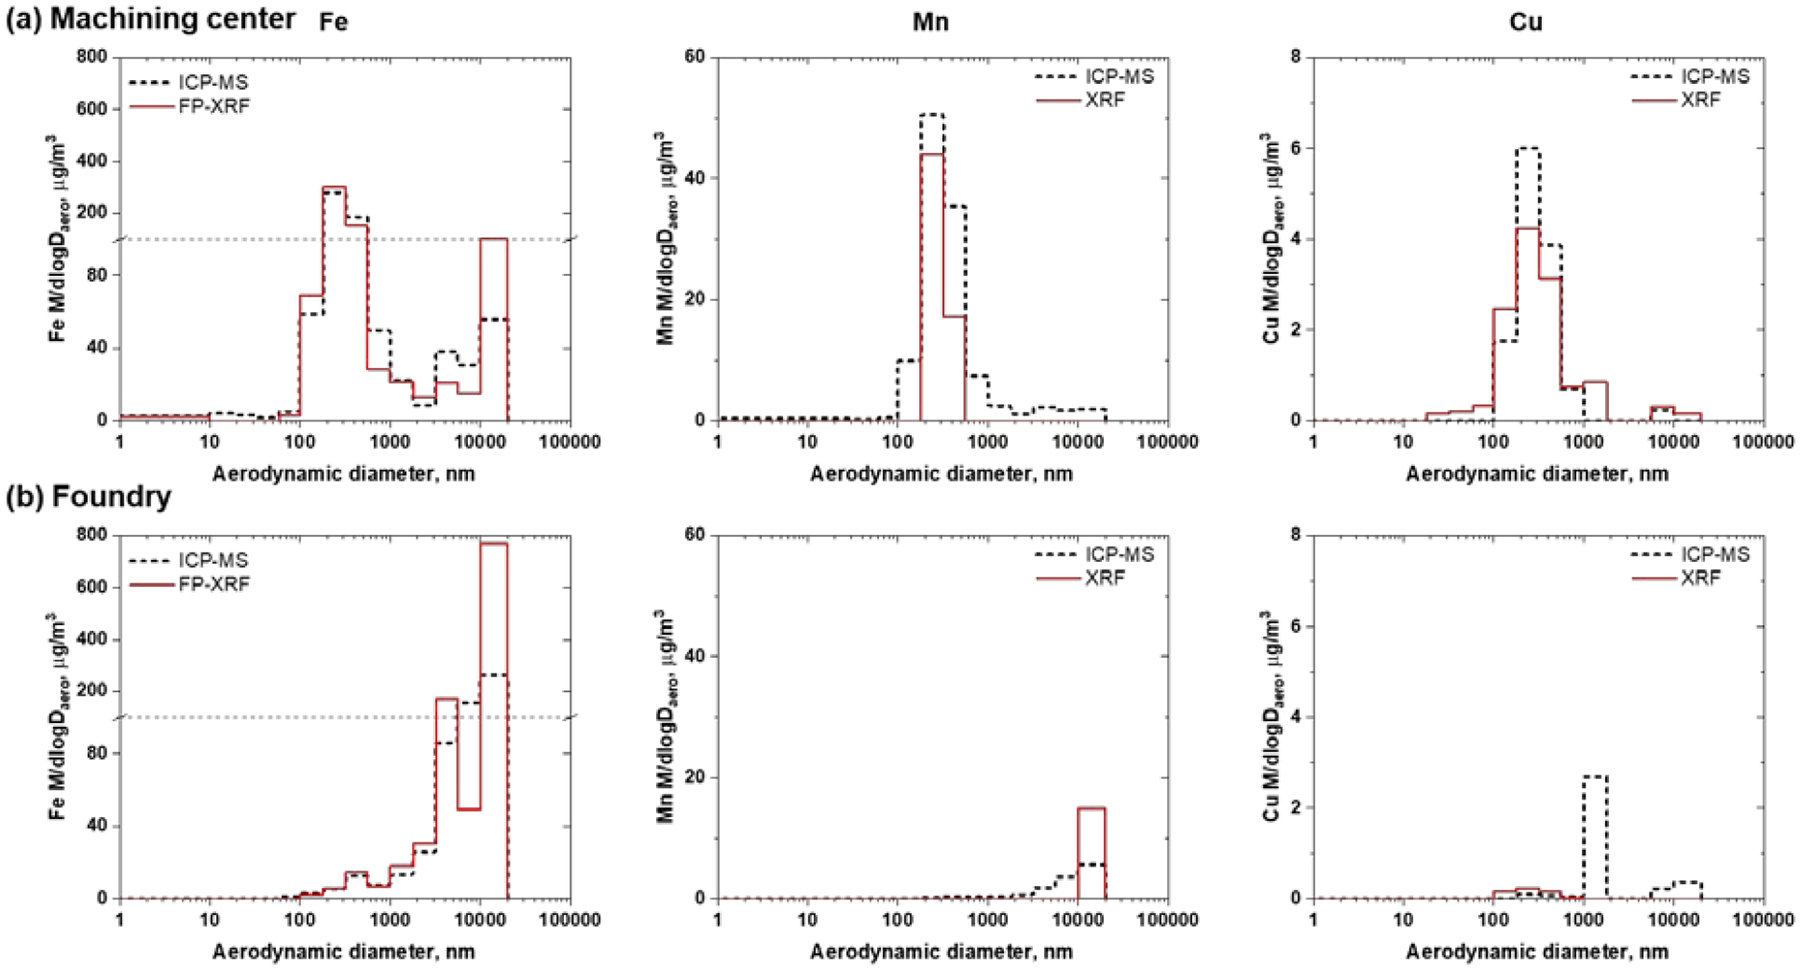
Figure 1.

Comparison of the Fe (left), Mn (middle) and Cu (right) concentrations between on-site and off-site nano-MOUDI measurements at the machining center (a) and foundry (b). Fe concentrations are really high for a few nano-MOUDI stages, therefore a grid line at 100 μg/m3 was added to mark a change in the scale dimensions.
