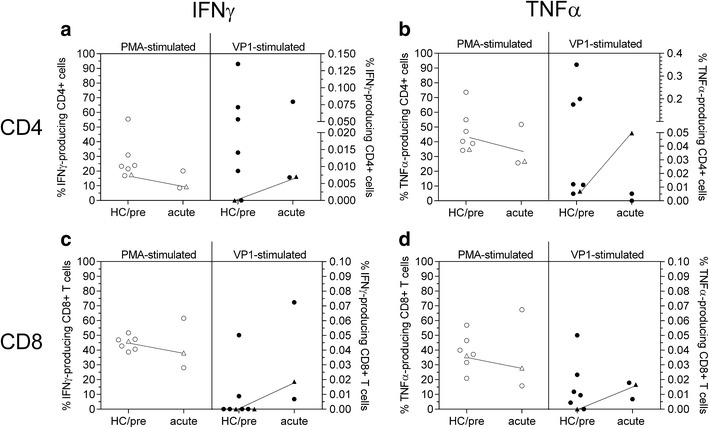
Fig. 1.

IFNγ (a, c) and TNFα (b, d) secretion of CD4+ (a, b) and CD8+ T cells (c, d) upon PMA (open symbols, left columns) stimulation, and stimulation with JCV VP1 peptide (closed symbols, right columns). Six healthy control samples (circles) and the described PML case 15 months before PML diagnosis (triangle) are shown in the left columns (HC/pre); two natalizumab PML survivors six months after diagnosis and the PML case (triangle) five weeks after PML diagnosis are shown in the right columns. Dotted line indicates detection threshold
