
Fig. 1.
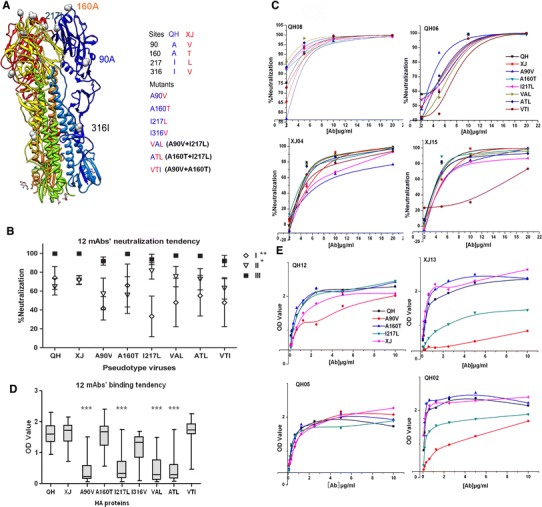
Neutralization and binding assays with QH and XJ H5N1 HAs. (A) The 3-D structure of the HA trimer (Protein Database [PDB] identifier 2IBX) [24] was used as an HA model to visualize the different aa positions in QH and XJ HA. Four different aa positions in QH and XJ HA and seven HA mutants are shown. (B) Neutralization by 12 mAbs in three groups is summarized in a dot-and-whiskers graph. **Group I vs. group III was P<0.01, while *group II vs. group III was P<0.05. (C) Dose-dependent neutralization assay carried out with four mAbs and eight HA pseudotype viruses. The neutralization activity of mAbs was calculated according to the following formula: (A-B)/A×100%. A represents the positive wells, which contained only pseudotype viruses. B represents the test wells, which contained a mixture of mAb and pseudotype viruses. (D) Twelve mAbs were used to measure the binding affinity to the HAs. ***A90V, I217L, VAL and ATL had significantly low binding to these mAbs (P<0.001). (E) Dose-dependent binding assay using four mAbs and five HA pseudotype viruses shown here as example. The ELISA assay was repeated more than three times. The neutralization assay was performed in triplicate. Results are the means of three similar experiments run in triplicate