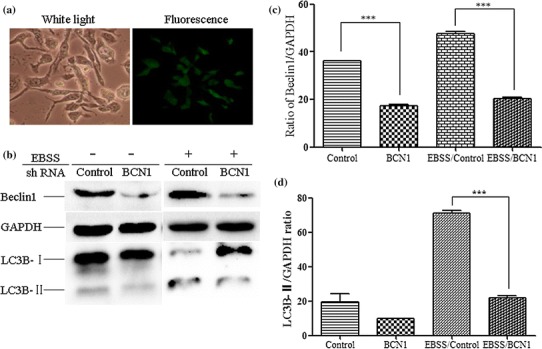
Fig. 1.

Generation of stable GFP-LC3-MDBK and shBCN1-MDBK cells. (a) Generation of GFP-LC3-MDBK stable cells. MDBK cells were transfected with 4 μg of pEGFP-LC3 plasmid, and fluorescence microscopy was used to identify stably transfected cells in the presence of 250 μg of G418 per ml. (b) Western blot analysis. MDBK cells were transfected with 4 μg of control shRNA plasmid or BCN1 shRNA plasmid, and the stable cells were screened in the presence of 0.1 μg of purine per ml. The control-MDBK or shBCN1-MDBK cells were starved in Earle’s balanced salt solution for 120 min. The cells were then lysed, and the protein levels were determined by western blot analysis. (c) Analysis of the band intensity ratio of BCN1 to GAPDH using ImageJ2x software. The results are indicated by graphs representing the ratio of BCN1 to GAPDH normalized to the control. (d) Analysis of the band intensity ratio of LC3-II to GAPDH. The results are indicated with graphs representing the ratio of LC3-II to GAPDH normalized to the control. The data are reported as the mean ± SD (n = 3). Significance was analysed using a two-tailed Student’s t-test. ***, P < 0.001
