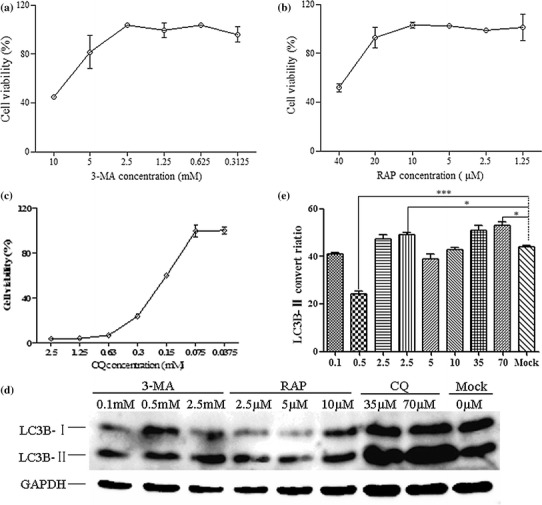
Fig. 2.

Optimum concentration of inducers or inhibitors of autophagy. (a-c) Cytotoxicity assays of 3-MA, RAP, and CQ. MDBK cells were treated with each drug at different concentrations for 12 h. The cell culture medium was replaced with fresh DMEM medium, the cells were cultured for 72 h, and cell viability was then quantitated. (d) Western blot analysis. MDBK cells were treated with each drug as described above at 0.1, 0.5, and 2.5 mM for 3-MA, 2.5, 5.0, and 10 μM for RAP, and 35 and 70 μM for CQ. (e) Analysis of the band intensity ratio of LC3-II to GAPDH. The results are indicated with graphs representing the ratio of LC3-II to GAPDH normalized to the control. The data are reported as the mean ± SD (n = 3). Significance was analysed using a two-tailed Student’s t-test. *, P < 0.05; ***, P < 0.001
