Fig. 3.


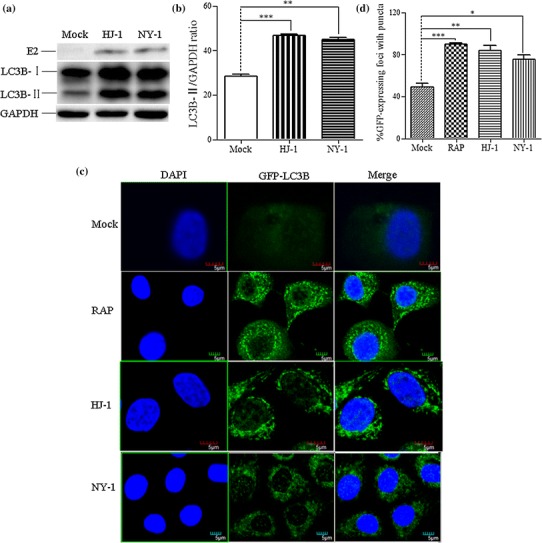
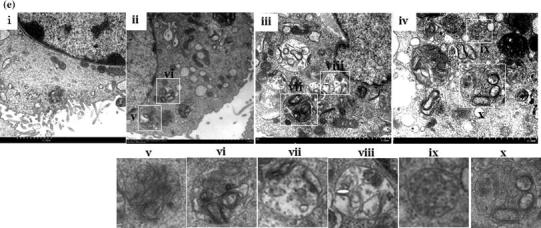
BVDV infection triggers autophagy in MDBK cells. (a) Western blot analysis. The turnover of LC3-I to LC3-II was detected for MDBK cells infected with NY-1 or HJ-1 at an m.o.i. of 2.5 or 5. Cells were harvested at 72 h postinfection and tested using an anti-LC3B antibody. GAPDH was used as a protein loading control. (b) The band intensity ratio of LC3-II to GAPDH. The results are indicated by graphs representing the ratio of LC3-II to GAPDH normalized to the control. The data are reported as the mean ± SD (n = 3). Significance was analysed using a two-tailed Student’s t-test. *, P < 0.05; ***, P < 0.001. (c) Confocal microscopy. MDBK/GFP-LC3 cells were mock treated as a negative control, with RAP as a positive control, or infected with NY-1 or HJ-1 at an m.o.i. of 2.5 or 5. (d) Proportion of GFP-expressing cells with puncta formation. For each sample, the total number of GFP-expressing foci and the number of foci with GFP puncta were counted in four separate fields. Data from at least four independent experiments were used for the analysis. Significance was analysed using a two-tailed Student’s t-test. *, P < 0.05; **, P < 0.01; ***, P < 0.001. (e) TEM observation of autophagosomes in MDBK cells. MDBK cells were mock treated as a negative control (i) or RAP as a positive control (ii), or infected with NY-1 or HJ-1 at an m.o.i. of 2.5 or 5 (iii, iv). Higher-magnification views of panels ii, iii, and iv are shown in panels v-x. Bars, 2 μm
