
Fig. 3.
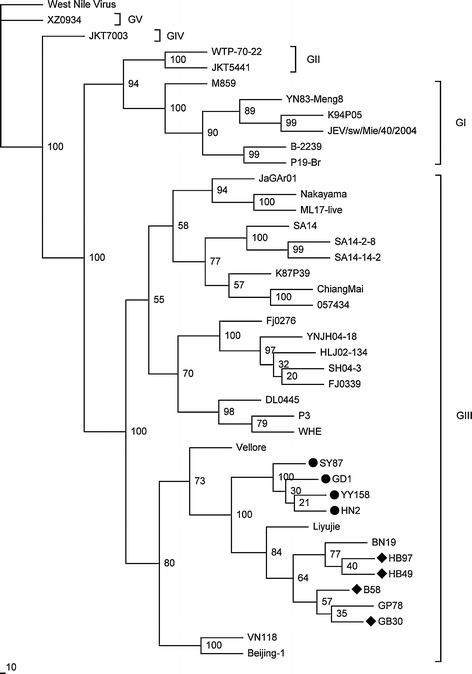
Phylogenetic tree generated based on the envelope (E) gene sequence using the maximum-likelihood method. Numbers above or below branches indicate neighbour-joining bootstrap values. West Nile virus was used as an outgroup. Genotypes are indicated on the right. The four bat JEV isolates sequenced in the present study are indicated with a circle on the left, and four other previously reported bat JEV isolates are indicated with a rhombus on the left. The scale bar indicates the number of nucleotide substitutions per site