Fig. 3.

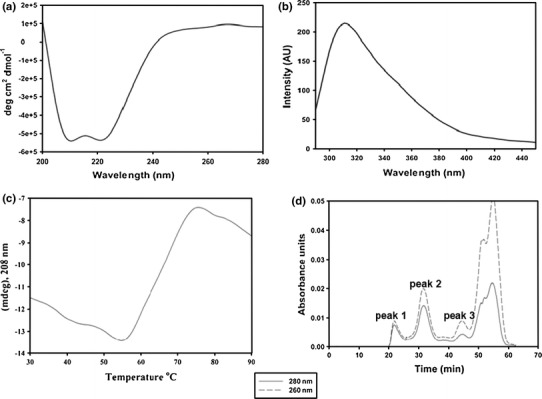
Biophysical characterization of GBNV N protein. a CD spectrum of N protein. The far-UV CD spectrum for the N protein (0.1 mg/ml) was recorded using a Jasco-815 spectropolarimeter. The molar ellipticity was calculated using a subunit mass of 32 kDa. b Fluorescence spectrum of N protein. The fluorescence spectrum for the N protein (0.1 mg/ml) was recorded using a Perkin Elmer LS 55 luminescence spectrometer after excitation at 280 nm. c Thermal melting profile of N protein. The molar ellipticity (y-axis) was monitored at 208 nm as a function of temperature (x-axis) and plotted as shown. d Elution profile of N protein on a Superdex S-200 analytical gel filteration column. Peak 1 represents the void fraction (›600 kDa). Peaks 2 and 3 correspond to 128-kDa (tetramer) and 32-kDa (monomer) proteins, respectively
