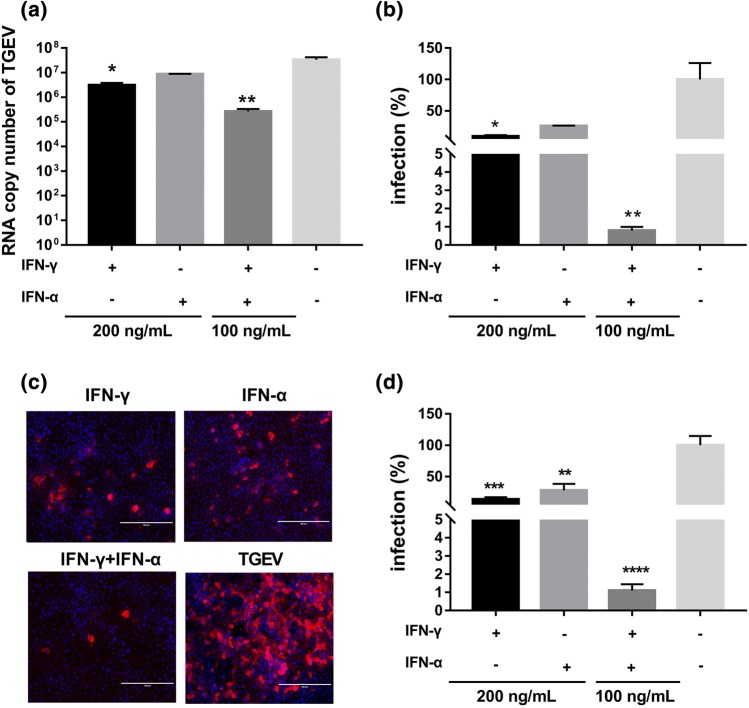
Fig. 6.
Synergistic antiviral effect of IFN-γ and IFN-α in ST cells. ST cells were treated with either IFN-γ or IFN-α alone at a concentration of 200 ng/mL, or with a combination of both (100 ng/mL each) and then infected with TGEV at an MOI of 0.01. TGEV infection was detected at 24 hpi by measuring the TGEV genomic RNA (a) or by IFA (c). The percentage of infected cells was calculated after the number of TGEV RNA copies in the IFN-treated groups was normalized to that in the untreated mock control (b). The percentage of fluorescence-positive cells 24 h after infection (c). TGEV-positive cells in six random fields (20X IFA image) were counted, and the percentage of infected cells was calculated after being normalized to the untreated mock control (d). Data are shown as the mean ± SEM. Significance was determined by Student’s t-test compared to the mock control, *, p < 0.5; **, p < 0.01; ***, p < 0.001; ****, p < 0.0001

