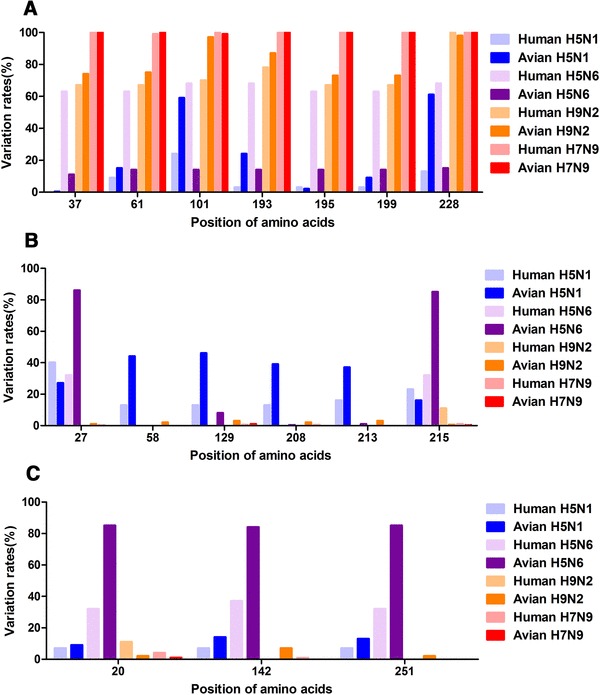
Fig. 2.

Comparison of the polymorphism of the PA-X protein from viruses of different subtypes. The amino acids (for example, 37A) indicated in the figure are represented as the original residues. Therefore, the calculated mutation rates shown in this figure are compared with the original residues. a Positions of variation rate which are obviously higher in the H7N9 and H9N2 viruses than in H5N1 and H5N6 viruses. b Amino acids those were more inclined to variation in H5N1 and H5N6 viruses than in H9N2 and H7N9 viruses. c Small group amino acids that showed obviously higher variation rates than other subtype viruses, especially in avian H5N6 viruses
