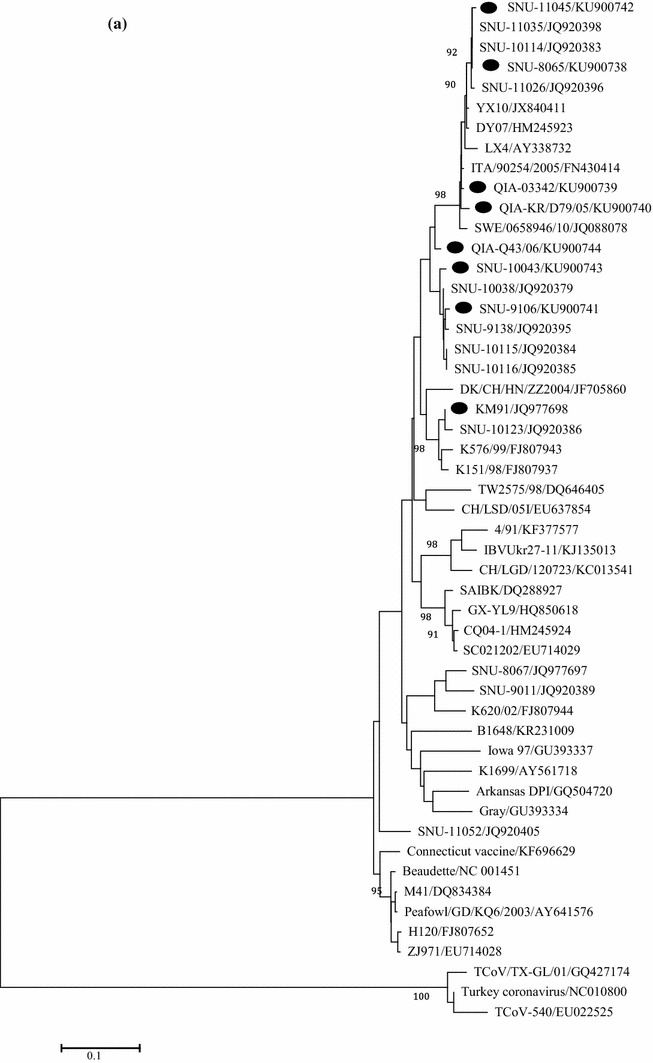
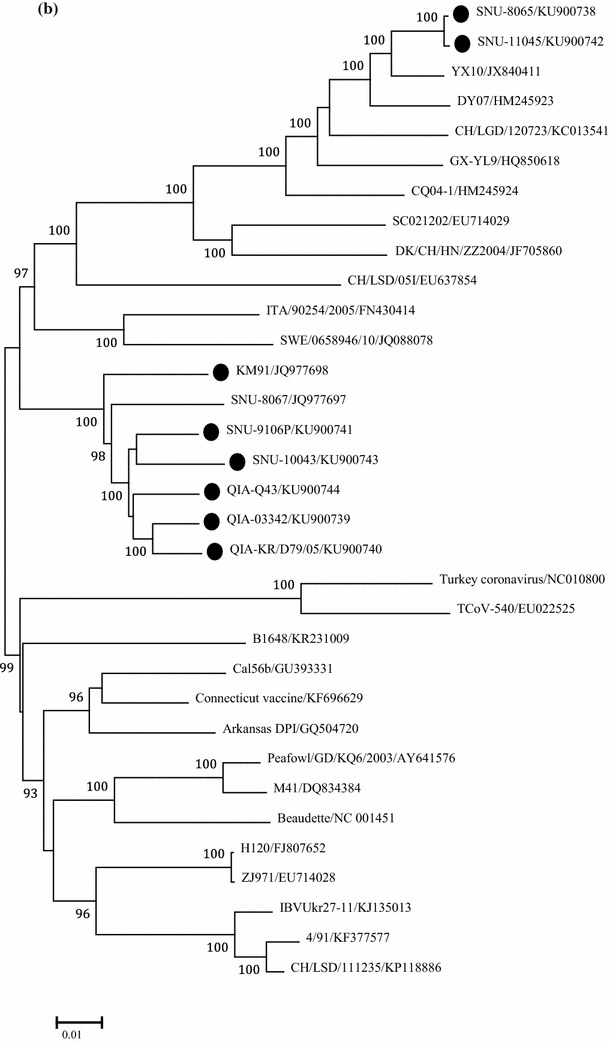
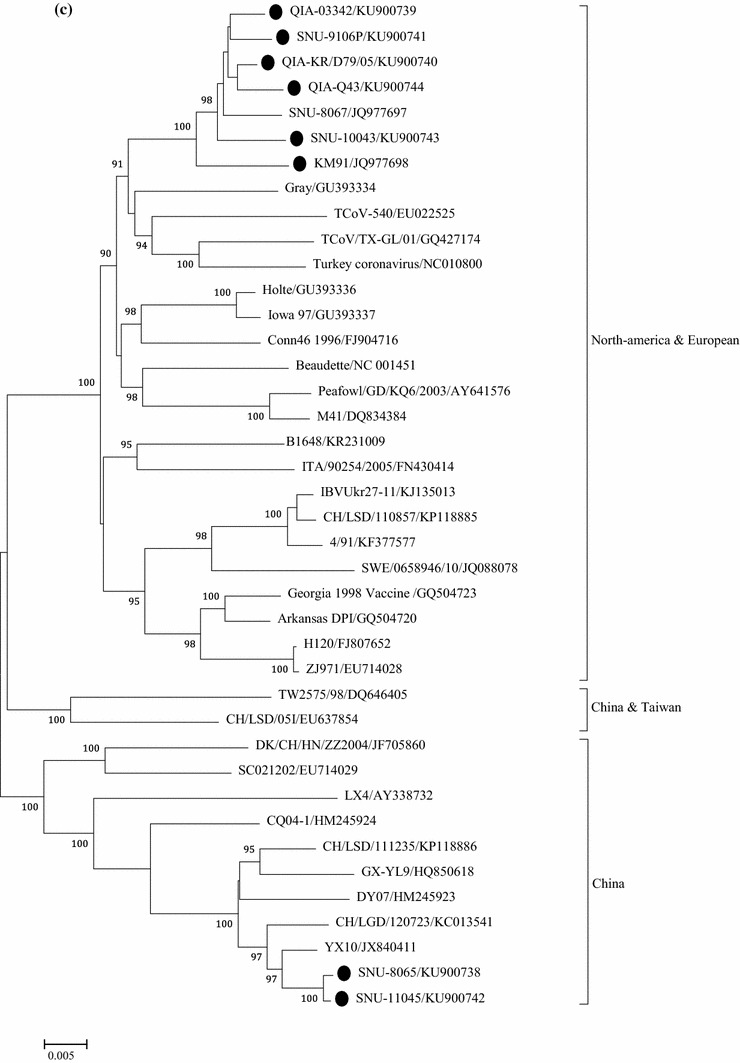
Fig. 2.


Phylogenetic trees based on: 1.5 kb nucleotide sequences of S1 (a), full genome (b), and 1ab genes (c), were constructed with the neighbor-joining method using MEGA 5.05. The bootstrap values were determined from 1000 replicates of the original data. The branch number represents the percentage of times that the branch appeared in the tree. Bootstrap values greater than 90% are shown. The p-distance is indicated by the bar at the bottom of the figure. The QX-like viruses characterized in the present study are marked with closed circles
