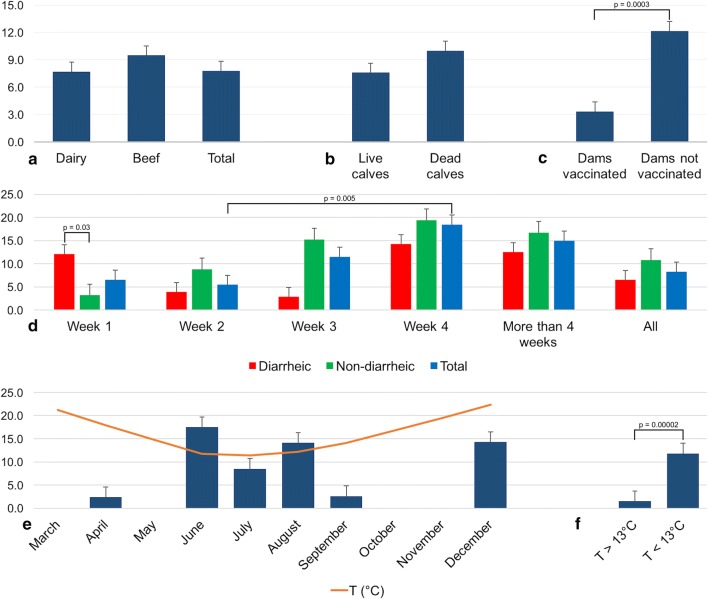
Fig. 2.
Comparison of BCoV detection rates in different groups. a) Frequency of BCoV detection in beef vs. dairy cattle. b) Frequency of BCoV detection in live vs. dead calves. c) Frequency of BCoV detection in calves born to vaccinated vs. unvaccinated dams. d) Frequency of BCoV detection according to the age in weeks in diarrheic and non-diarrheic calves, and the total number of calves. e) Frequency of BCoV detection according to the month of sampling. f) Frequency of BCoV detection according to the ambient temperature. Comparisons between groups with statistically significant differences are shown

