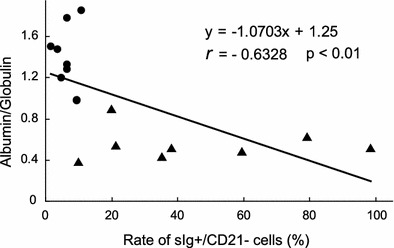
Fig. 2.

Correlation between the albumin-to-globulin ratio in plasma samples and the ratio of sIg+ CD21− B-cells in PBMCs of cats. Circle SPF cats (n = 8), triangle FIP cats (n = 8)

Correlation between the albumin-to-globulin ratio in plasma samples and the ratio of sIg+ CD21− B-cells in PBMCs of cats. Circle SPF cats (n = 8), triangle FIP cats (n = 8)