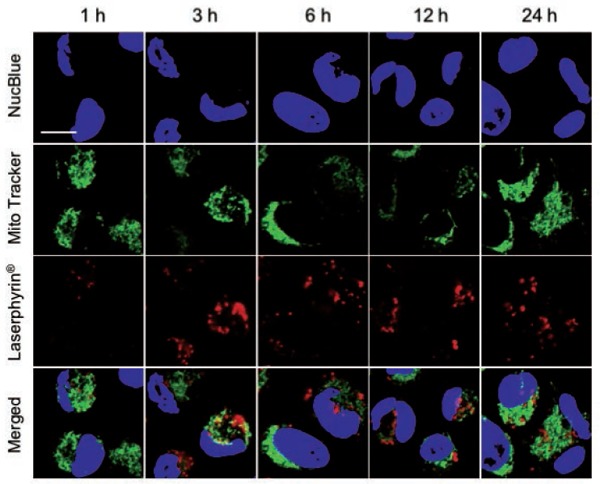
Figure 7:

Subcellular localization of Laserphyrin®. PC-3 cells were incubated in 3.75 mM Laserphyrin® solution for various incubation periods. Fluorescence images of nuclei (blue), mitochondria (green), and Laserphyrin® (red) were visualized by confocal microscopy. In the merged images, there are many areas of distinct green mitochondrial fluorescence, indicating that only a few mitochondria colocalized with Laserphyrin®. Scale bar, 50 µm.
