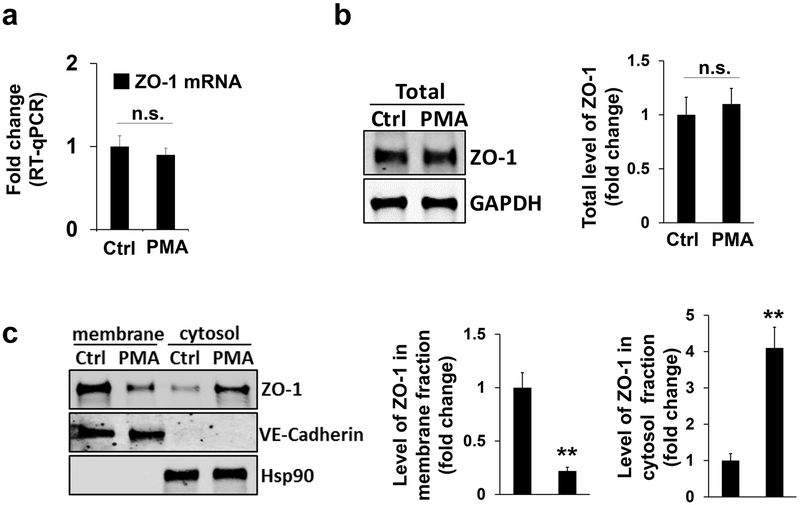
Figure 4. ZO-1 relocates from plasma membrane to podosomes.
(a-b) Quantitative RT-PCR or Western blotting revealed the mRNA level (a) or total protein level (b) of ZO-1 in HBMECs in the absence (as indicated by Ctrl treatment (DMSO)) and presence of PMA treatment (100 nM for 1 hour). GAPDH as loading control, n=3. (c-e) HBMECs in the absence (Ctrl) and presence of PMA treatment were subject to membrane protein extraction assay. Western blotting showed the protein level of ZO-1 in either plasma membrane or cytosol using ZO-1 antibody, and quantifications were shown in the bar graphs. VE-cadherin as loading control for membrane fraction while Hsp90 for cytosol fraction. Data were represented as mean±s.e.m. n=3. n.s.: not significant **p<0.01.

