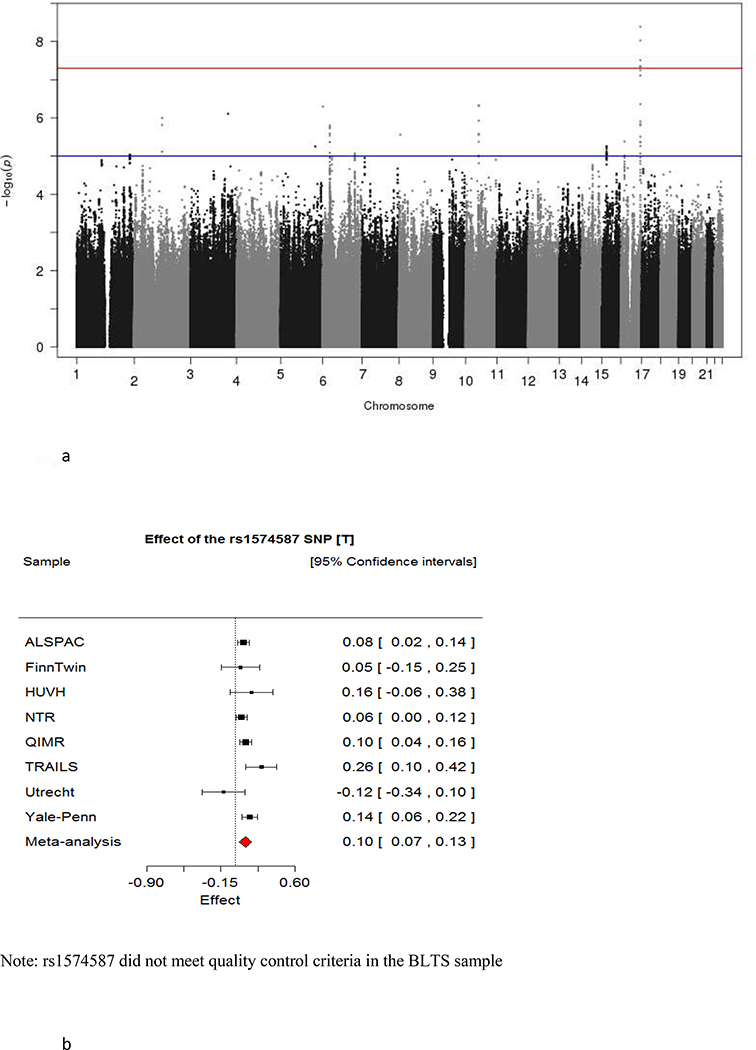
Figure 2:
The Manhattan plot of the meta-analysis results for the discovery sample (a). In the Manhattan plot, the y-axis shows the strength of association (-log10(P)) and the x-axis indicates the chromosomal position. The blue line indicates suggestive significance level (P < 1E-05) while the red line indicates genome-wide significance level (P < 5E-08); (b) Forest plot of the top SNP (rs1574587) on Chromosome 16 in eight discovery cohorts.

