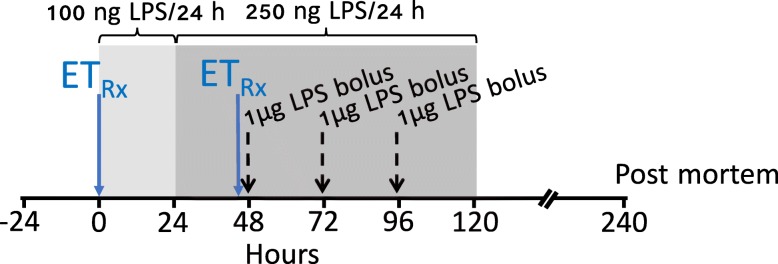
Fig. 1.
Schematic outlining the study design. The study consisted of 3 groups: control (n = 7), LPS (n = 8), and Etanercept (ET) + LPS (n = 8). The light shaded area represents the period of low dose LPS infusion (100 ng LPS/24 h), the dark shaded area represents the period of increased infusion (250 ng LPS/24 h). The black dashed vertical lines show the timing of LPS bolus administration. The solid blue vertical lines show the timing of (5 mg/kg) Etanercept administration, which were 30 min before starting LPS infusion and 30 min before the first LPS bolus. Controls received an equivalent volume of vehicle (saline) during the infusion and bolus periods. Continuous physiological recordings were performed throughout the experimental period. Fetal preductal arterial blood was collected every morning starting from 30 min before the experiment until the day of post mortem. Additional blood samples were collected immediately before the LPS or saline boluses and 2 and 6 h after bolus infusions for measurement of cytokine levels

