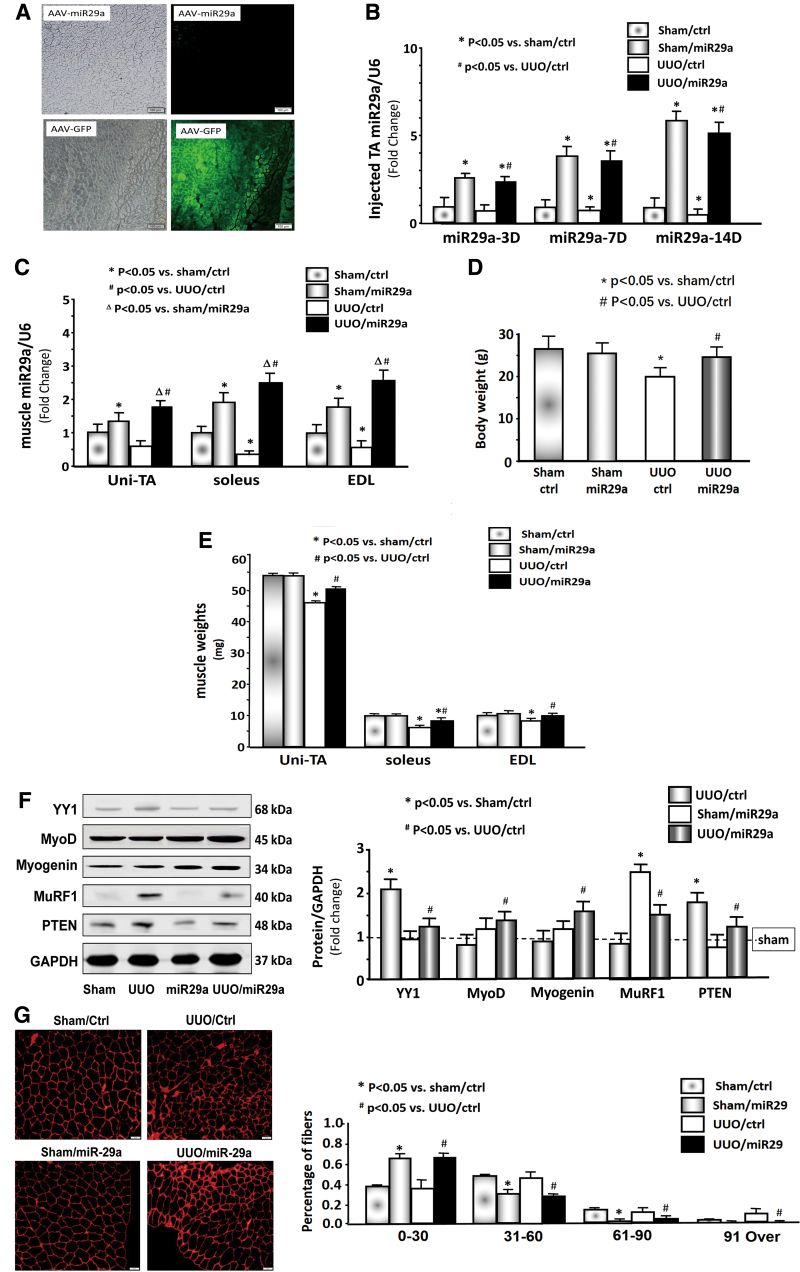
Figure 2.
Provision of AAV-miR29a attenuated UUO-induced muscle loss. (A) Representative frozen cross-sections from TA muscles transduced with AAV in the normal control mice. The right panels show fluorescence microscopy images for detecting GFP expression; the left panels show bright-field microscopic images of muscle cross-section. The top panels show microscopy images in mice with AAV-miR-29 transduction. The bottom panels show microscopy images in mice with AAV-GFP transduction. (B) miR-29a/U6 expression in the TA muscle (n = 9/group). (C) miR-29a/U6 expression in the uninjected TA (Uni-TA), soleus, and EDL (n = 9/group). (D) Body weights and (E) muscle weights of sham-operated and UUO cohorts (n = 9/group). (F) Expression of YY1, myoD, myogenin, MuRF1, PTEN, and GAPDH. The bar graph shows the fold change of each protein band compared with the levels in sham mice (represented by a line at onefold) (n = 6/group). (G) The representative cross-sectional area of TA muscle of sham/ctr and UUO cohorts (n = 9/group). AAV, adeno-associated virus; EDL, extensor digitorum longus; GFP, green fluorescent protein; TA, tibialis anterior; UUO, unilateral ureteral obstruction. Color images are available online.

