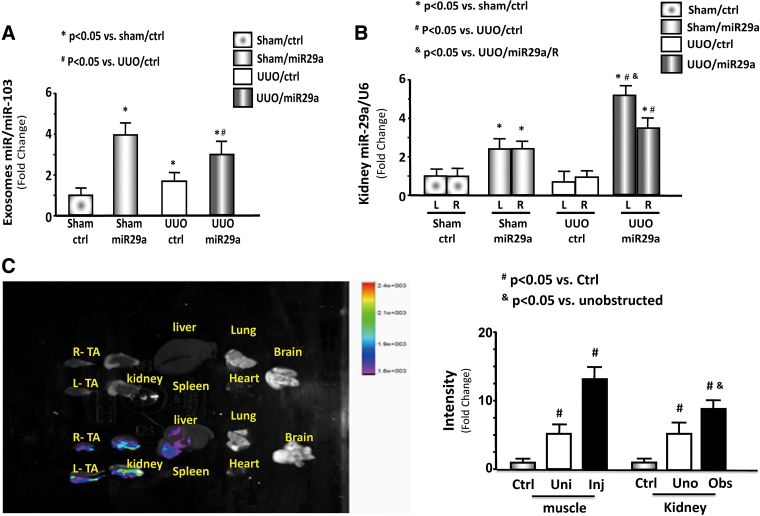
Figure 4.
Evidence of miR-29a travel from the muscle to the kidney through exosome circulation of exosomes. (A) miR-29a/miR103 expression and bar graph showing miR expression in the serum exosomes of each group of mice. (n = 6/group). (B) Expression and bar graph of miR-29a/U6 in the right and left kidneys of each group of mice (n = 6/group). (C) Representative fluorescent organ images. Mice were injected in the left TA muscle with AAV/miR-ctrl (GFP positive). The fluorescence was assessed 14 days after injection. In each pair, the left kidney received UUO ligation (Obs = obstructed kidney), and the right was not obstructed (Uno = unobstructed kidney). The left TA muscle was transduced by AAV (Inj = injected muscle) and the right muscle was not (Uni = uninjected). Bar graph showing GFP intensity from AAV-GFP transduced mice compared with non-AAV injection mice (n = 3/group). AAV, adeno-associated virus; GFP, green fluorescent protein; TA, tibialis anterior; UUO, unilateral ureteral obstruction. Color images are available online.

