
FIGURE 1.
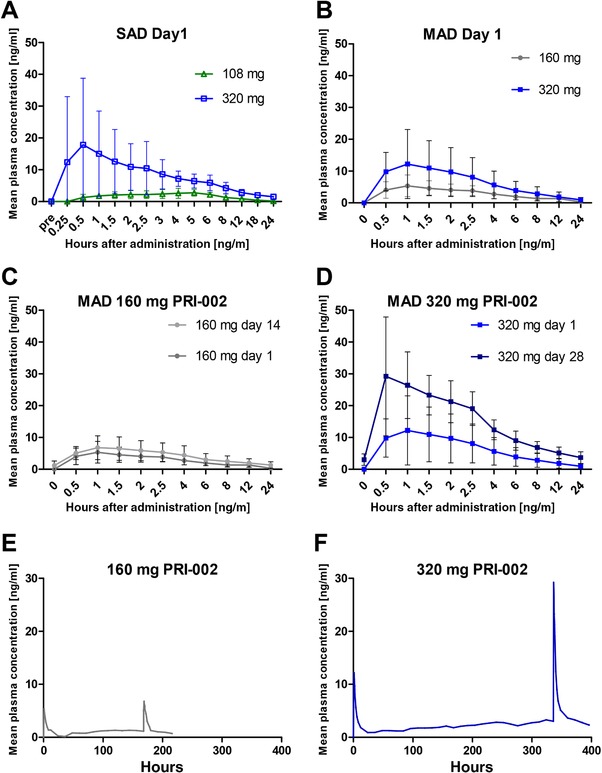
Mean plasma concentrations of PRI‐002 over time. (A) Pharmacokinetic (PK) profile of PRI‐002 after single oral doses. (B) Pharmacokinetic profile of PRI‐002 after a single oral dose of 160 mg compared to 320 mg. (C) and (D) Comparison of pharmacokinetic profiles of PRI‐002 between a single dose (day 1) and multiple oral doses (day 14/28) of 160/320 mg. (E) and (F) Mean plasma concentrations of PRI‐002 over time for the 160 and 320 mg cohorts. Please note that PK sampling was done only during the first 24 hours and after the last dosing for each cohort. On all other days, only one measurement has been done, pre‐dose. The lower limit of quantification (LLOQ) had been set to 0.5 ng/mL. PRI‐002 values of <0.5 ng/mL were set to zero for PK calculations