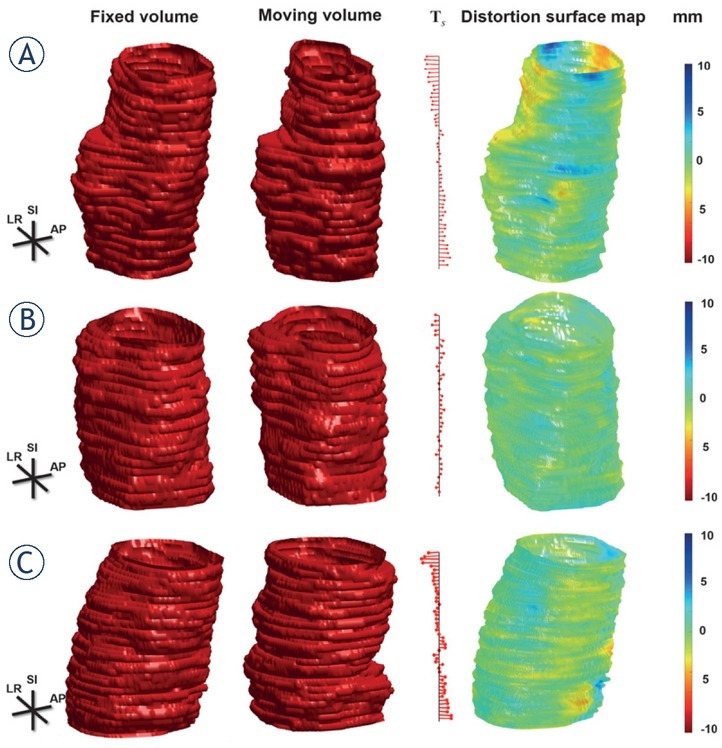
Figure 2.

Example distortion maps of three MRI studies. (A) showing significant prostate translocation with significant base distortion in a study from the rectal group, (B) showing negligible prostate translocation and distortion in a study from the bladder group, and (C) showing significant prostate translocation but negligible prostate distortion in a study from the bladder group. The fixed and moving volumes are depicted in the first and second columns, respectively. In order to show the slice section difference as well as the local translation, the ‘tree’ of slice centroid translations Ts and the distortion surface map (along with the corresponding colour map expressed in mm) are shown in the third and fourth (fifth) columns, respectively.
